Configuration
To configure the OBP60, the device must be powered on. Switch on the power supply; the OBP60 firmware will then start. A beep will sound after the initialization phase is complete. The Open Boat Projects logo will first appear on the display, followed by a QR code showing the login credentials for the OBP60’s access point. Both images will be visible for a few seconds. You can scan the QR code with your smartphone camera and use these credentials to log in to the OBP60’s Wi-Fi network.
Image: Start screen with OBP logo
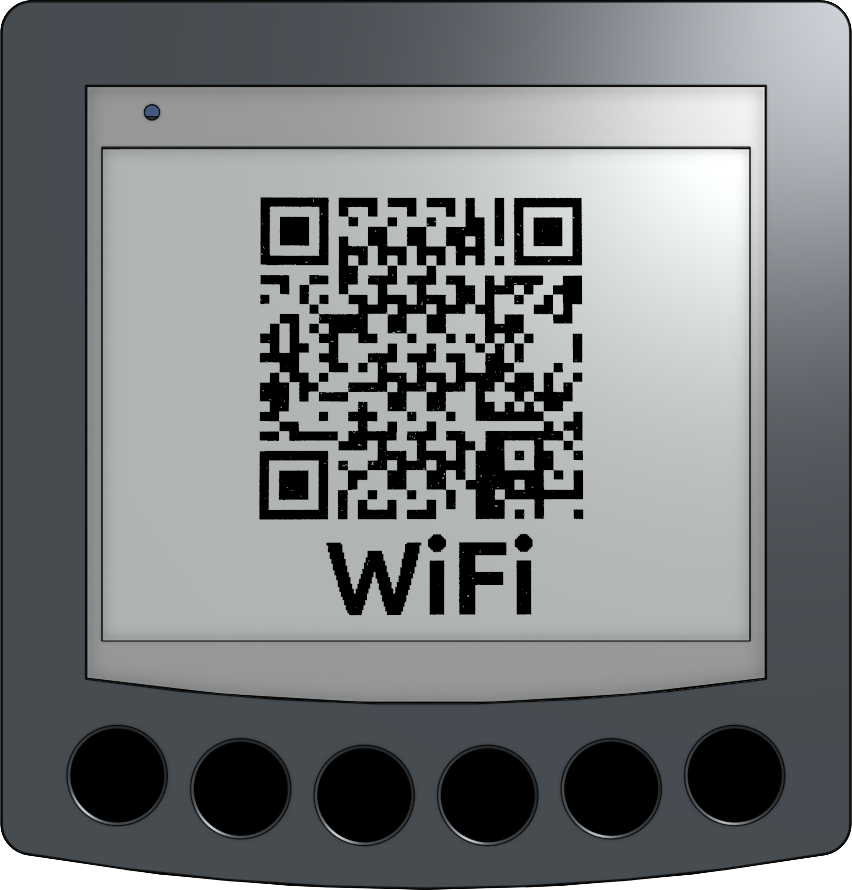
Image: QR code for WiFi access
On Android 10 and later, open your Wi-Fi settings and display all available Wi-Fi networks. At the bottom of the list, under “Add a network,” you’ll find a small blue QR code icon on the right. Clicking this icon opens a window for scanning the QR code. After a successful scan, your device will automatically connect to the Wi-Fi network. You don’t need to enter the SSID or password. For older Android versions, there are scanner apps that offer similar functionality.
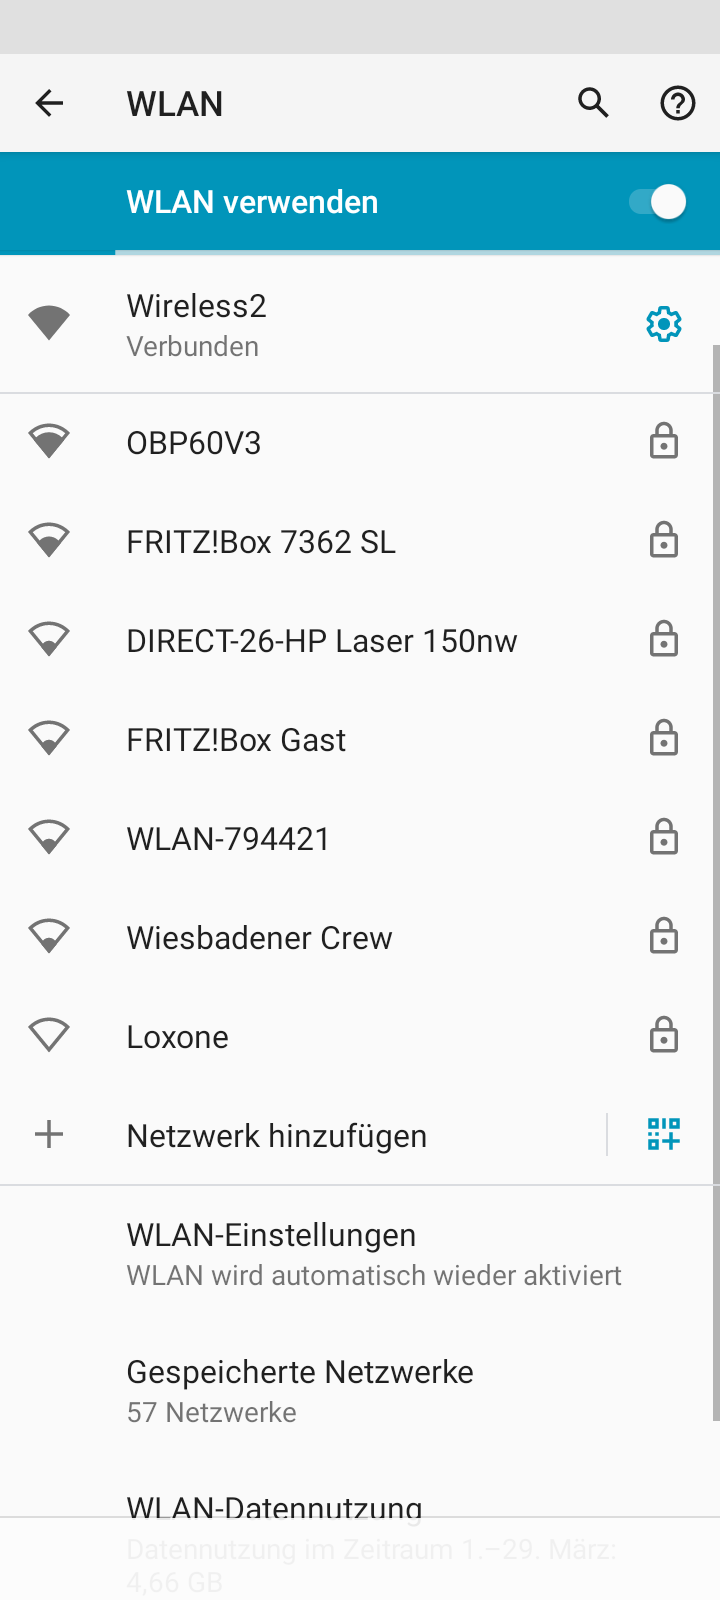
Image: Wi-Fi settings under Android 11
Note
If connecting to the OBP60’s Wi-Fi network via QR code fails, you can also configure it manually. Use the following access data:
SSID: OBP60V2
Password: esp32nmea2k
Once your device is connected to the Wi-Fi network, open a web browser and enter the address OBP60V2.local or the IP address 192.168.15.1. This will take you to the OPB60 user interface, where you can check the device’s current status. The user interface contains tabs that allow you to select different configuration options.
Status - Status display with overview of the bus systems
Config - General configuration page
XDR - Configuration page for NMEA0183-XDR-Sentences
Data - Data Display Dashboard
Update - Firmware update page
Help - Accessing the Github project page
Note
Note that no password is required when saving the configuration the first time you access the configuration interface. The default password is esp32admin. You can also enter your own password, using only characters from the ASCII character set. The password prompt can also be disabled.
Status
The status page displays the Wi-Fi connection status at the top. A green dot indicates that the Wi-Fi connection is active. A red dot indicates that there is no Wi-Fi connection.
Note
For better understanding, it’s important to note that the OBP60 establishes its own independent Wi-Fi network; this function is also known as access point mode. The number of TCP clients displayed in the status bar #clients always refers only to the clients that connect to the OBP60 in access point mode. The OBP60 can also connect to another, external Wi-Fi network by registering as a client. In this case, the OBP60’s own Wi-Fi network is bridged with the external Wi-Fi network. All data from the OBP60 is then available in both networks.
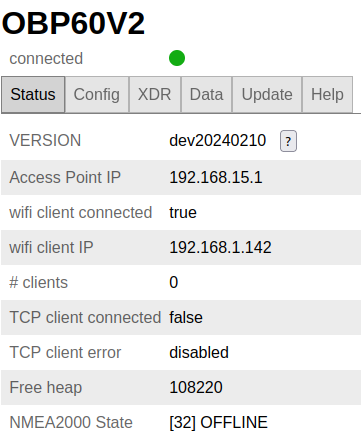
The information in the status area has the following meaning:
- Version
Current firmware version
- Access Point IP
IP address of the access point (if it’s the OBP60)
- WiFi Client connected
Indicates whether the OBP60 is connected to a different external WiFi network as a client.
- WiFi Client IP
IP address assigned to the OBP60 (when the OBP60 is connected as a WiFi client)
- #Clients
Number of clients that have connected to the OBP60 as a server via its access point
- TCP client connected
This displays the connection status of the OBP60. false = OBP60 is not connected to another device as a TCP client. true = OBP60 is connected to another device as a TCP client.
- TCP client error
This displays the error status of the OBP60 for TCP client connections.
- Free heap
Displays the amount of free heap memory in bytes. Heap memory is required for processing information and must not become too small. The memory size changes dynamically depending on CPU load. This value can be used for diagnostic purposes.
- NMEA2000 State
Displays the status of the NMEA2000 bus.
- NMEA2000 in
Number of NMEA2000 telegrams received
- NMEA2000 out
Number of NMEA2000 telegrams that were sent
- USB in
Number of NMEA0183 telegrams received via USB
- USB out
Number of NMEA0183 telegrams sent via USB
- TCPServer in
Number of NMEA0183 telegrams received via TCP
- TCPServer out
Number of NMEA0183 telegrams sent over TCP
- Serial in
Number of NMEA0183 telegrams received via RS485
- TCPClient out
Number of telegrams sent by the OBP60 as a TCP client
- TCPClient in
Number of telegrams received by the OBP60 as a TCP client
Clicking the question mark next to Version displays all telegrams that the OBP60 can process. More detailed information about the received telegrams can be found by expanding the row for the respective bus system. A table listing all NMEA0183 and NMEA2000 telegrams that can be processed is included in the appendix.
Config
The configuration page is divided into two sections. The firmware is based on the NMEA2000 Gateway project and utilizes the entire underlying structure of this software project. The functionality of the OBP60 is implemented as a separate task within the NMEA2000 Gateway firmware. The first section contains the configuration for the NMEA2000 Gateway. The second section contains the configuration for the OBP60 hardware and software. The second section is identified by the prefix “OBP”.
Configuration for the NMEA2000 gateway
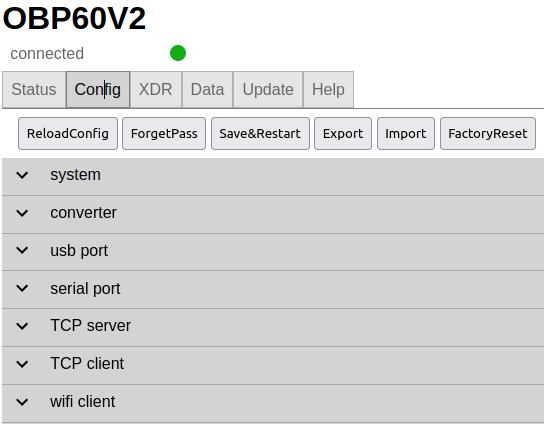
Fig.: Configuration for the NMEA2000 gateway
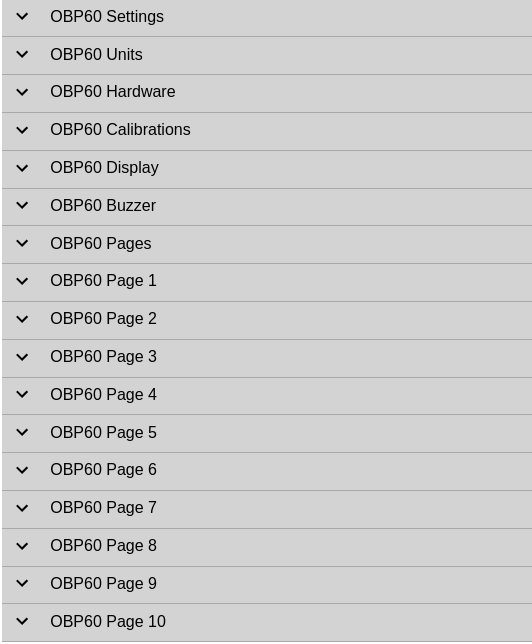
Fig.: Configuration for OBP60 hardware
Several buttons are visible at the top of the configuration page. The meaning of these buttons is listed below:
Reload Config - Reload the configuration
Forget Pass - Remove the login password from the browser’s cache.
Save & Restart - Save the configuration and then restart the firmware
Export - Export a configuration as a JSON file
Import - Importing a configuration via a JSON file
Factory Reset - Reset all settings to factory defaults
Config - System
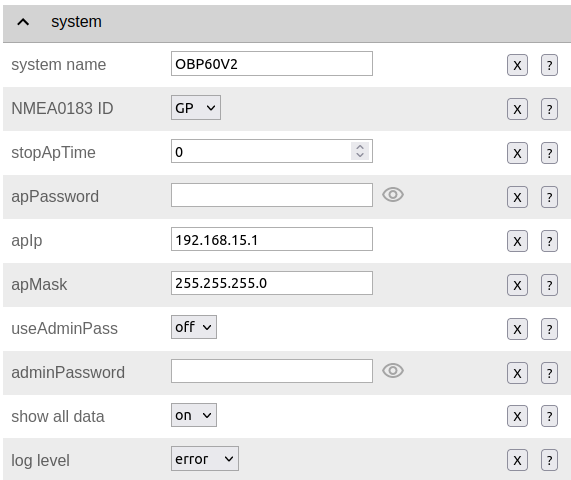
Under System, basic settings are configured, such as:
- System Name
Device name of the OBP60. A name of up to 10 ASCII characters can be used here. Only letters and numbers are allowed. The hyphen and underscore are also permitted. Special characters are not allowed, as the device name is also used as the SSID in the Wi-Fi network.
- NMEA0183 ID
Here you can specify which prefix is used as the device ID in NMEA0183 telegrams. Different device IDs can be configured. Details can be found under the following Link.
- Stop AP Time
This setting allows you to specify after how long the WiFi access point should be switched off. The time is specified in seconds. A value of 0 ensures that the WiFi access point remains on continuously.
- AP Password
This is where you enter the password for the WiFi access point. Only characters from the ASCII character set may be used. A password is enabled by default. The password esp32nmea2k is used.
- AP Ip
Here you can configure the IP address of the WiFi access point. By default, the IP address is 192.168.15.1. In exceptional cases, the IP address can be changed. Please note that if the IP address is changed, the OPB60 may no longer be reachable on your WLAN.
- AP Mask
This field specifies the subnet mask for the WiFi access point. The default subnet mask is 255.255.255.0. It is strongly recommended that you do not change this value unless you know exactly what the consequences of doing so would be.
Warning
Ensure that the address range of the WiFi access point differs from the address range of the network to which the OBP60 connects as a WiFi client. A network’s address range is identified by the first three groups of digits (111.222.333.xxx). Only the last group (xxx) is used for device identification within the same network. If you change the first three groups of digits in the address range, you will no longer be able to easily access the OPB60’s configuration pages. In most cases, changing the IP address or subnet mask will not be necessary. Therefore, only change the IP address and subnet mask if you have sufficient networking experience and understand the consequences of your changes.
- Use Admin Pass
This allows you to specify whether a password is required to change the configuration.
- Admin Password
Enter the administrator password here. Only ASCII characters are permitted. Password prompts are enabled by default, and the password esp32admin is used. No password is required the first time a configuration is saved after a reboot. This allows you to change the password at any time.
- Show All Data
If the menu displays
on, all sensor data is shown in the Data area. Switching tooffdisables all sensor data in the Data area.
Log Level
- The Log Level setting allows you to adjust the level of detail in notifications sent via the USB-C interface. The following settings are available:
Off- No logging output
Error- Only error messages are displayed
Log- Error messages and status information are displayed.
Debug- All intended messages, including debug messages, are displayed.
Hint
If you intend to perform NMEA0183 data exchange via the USB-C interface, you should set the Log Level to off. Failure to do so can make evaluating log output very confusing, as log data and NMEA0183 telegrams will then be displayed mixed together. If you only want to see log output, set NMEA to USB and NMEA from USB under Config - USB Port to [off.
Config - Converter
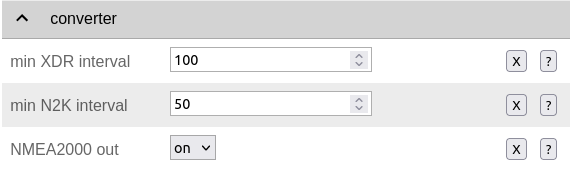
The following settings allow you to change the function of the NMEA2000 gateway.
- Min XDR Interval
Here you set the interval time for XDR signal processing. XDR telegrams are freely definable sensor telegrams. The interval time can be set from 10 ms. The default value is 100 ms. With the shortest interval time of 10 ms, a data processing rate of 100 Hz is achieved.
- Min N2K Interval
Here you set the interval time for NMEA2000 signal processing. The interval time can be set from 5 ms. The default value is 50 ms.
Note
Keep in mind that short interval times place a high load on the processor. Adjust the value so that your data can still be processed correctly. Most applications can run smoothly with the default values of 100 ms for the XDR interval and 50 ms for the N2K interval.
- NMEA2000 out
- Here you can configure whether NMEA2000 telegrams are transmitted to the NMEA network.
On- Output of NMEA2000 dataOff- No output of NMEA2000 data
Config - USB Port
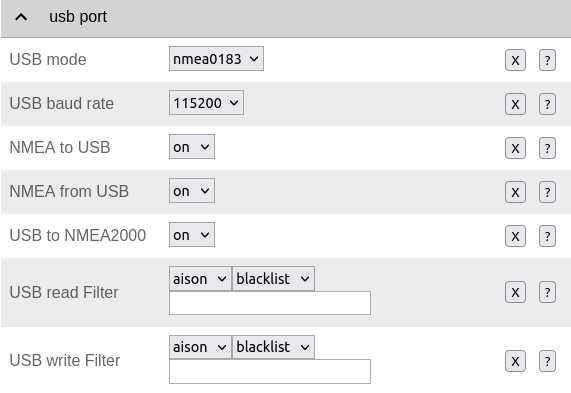
The functions of the USB port can be configured in detail via the USB Port page.
- USB Mode
The format defines how data is processed at the USB port. The Actisense format allows NMEA2000 telegrams to be received and processed by external software. Actisense data is translated within the device into NMEA2000 and NMEA0183 data. For example, the Actisense Simulations- und Diagnosesoftware can be used to analyze the bus data.
Nmea0183- Processing in NMEA0183 format
Actisense- Processing in Actisense format
- USB Baud Rate
Here you can adjust the interface speed of the serial USB interface. Speeds between 1200 baud and 460800 baud can be set.
Hint
Set the interface speed high enough to process all data telegrams within the transmission interval. The default value of 115,200 baud is sufficient for most applications.
The following three settings allow you to configure the data direction at the USB-C interface. A distinction is made between NMEA0183 and NMEA2000.
- NMEA to USB
On- NMEA0183 data is output to the USB interfaceOff- NMEA0183 data is not output to the USB interface
- NMEA from USB
On- NMEA0183 data is received from the USB interfaceOff- NMEA0183 data is not being received from the USB interface
- USB to NMEA2000
On- Data is forwarded from the USB interface to the NMEA2000 busOff- Data is not being passed from the USB interface to the NMEA2000 bus
The next two settings configure the USB read Filter and USB write Filter for reading and writing data via the USB interface. Only NMEA0183 data can be filtered. It is possible to configure separately whether AIS position signals are processed. The available filter types are <Whitelist> and <Blacklist>: Whitelist allows you to specify filter criteria that should include the data, while Blacklist specifies criteria that exclude certain data.
- USB Filter
Aison- AIS data is processed at the USB interface.Aisoff- AIS data on the USB interface is not processed.Blacklist- The filter uses a blacklist. The flagged telegrams will not be processed.Whitelist- The filter works with a whitelist. Only the listed telegrams are processed.
The input field is used to enter the short identifiers of the NMEA0183 telegrams. Multiple entries are separated by commas ,. The following short identifiers can be used:
DBK, DBS, DBT, DPT, GGA, GLL, GSA, GSV, HDM, HDT, MTW, MWD, MWV, RMB, RMC, ROT, RSA, VHW, VTG, VWR, XDR, XTE, ZDA
The exact meaning of the abbreviations is explained in hier.
Hint
Filter functions are a powerful tool for controlling data flows. Before configuring them, consider how your data flows should look on the boat and create a sketch of it. Use the filters so that they only send and receive the data they actually need. Distinguish between what should be sent and what should be received, and under no circumstances create data loops.
Warning
Data loops lead to device malfunctions. In data loops, the same data circulates through multiple devices in a loop. This results in high transmission rates because the same data is continuously sent and received. The processor load increases to its maximum. In some cases, the device may fail, no longer be able to process the incoming data in a timely manner, or become unusable. Note that this condition can also occur if additional devices are subsequently connected to the bus system.
Config - Serial Port
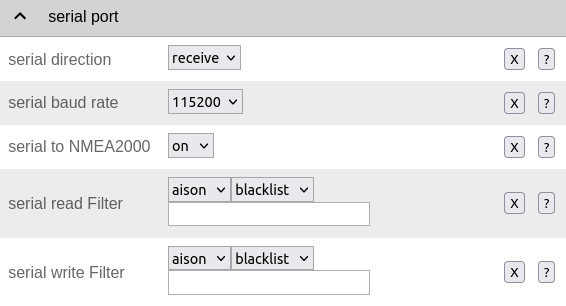
Settings for the serial NMEA0183 interface can be configured via serial port. These settings relate to the RS485 interface on connector CN1 with the signals A, B and Shield.
- Serial Direction
Off- The NMEA0183 interface is switched off.Send- The NMEA0183 interface sendsReceive- The NMEA0183 interface receives
Note
The serial interface is RS485 and RS422 compliant and operates in half-duplex mode. It can either send or receive data; both simultaneously are not possible. If you require full-duplex transmission for NMEA0183 data, you can use the USB-C interface. However, this interface is not RS485 or RS422 compliant. It can be useful if you want to process data, for example, in OpenCPN on a PC or laptop.
- Serial Baud Rate
Baud rate setting between 1,200 and 460,800 baud.
- Serial To NMEA2000
On- Data at the interface is transmitted according to NMEA2000 (gateway function)Off- Data at the interface is not transmitted according to NMEA2000.
The next two settings configure the Serial Read Filter and Serial Write Filter for reading and writing data on the serial interface. Only NMEA0183 data can be filtered. It is possible to configure separately whether AIS position signals are also processed. Whitelist and blacklist filters are available.
- Serial Filter
Aison- AIS data is processed at the USB interface.Aisoff- AIS data on the USB interface is not processed.Blacklist- The filter uses a blacklist. The flagged telegrams will not be processed.Whitelist- The filter works with a whitelist. Only the listed telegrams are processed.
The input field is used to enter the short identifiers of the NMEA0183 telegrams; multiple entries are separated by commas ,. The following short identifiers can be used:
DBK, DBS, DBT, DPT, GGA, GLL, GSA, GSV, HDM, HDT, MTW, MWD, MWV, RMB, RMC, ROT, RSA, VHW, VTG, VWR, XDR, XTE, ZDA
The exact meaning of the abbreviations is explained in hier.
Config - TCP Server
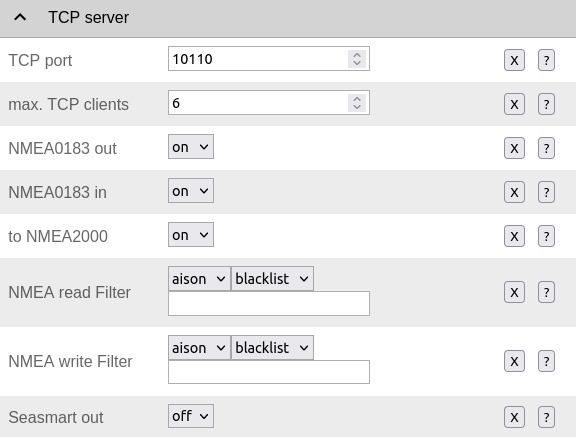
Here you configure the settings for operating the OPB60 as a TCP server. The TCP server is a server service that allows data to be read and written. A network device actively connects to the server as a client via a TCP port and can then exchange data with the TCP server.
Note
The login process must always be initiated by the client. In case of connection interruptions, the client must re-establish the connection automatically. Ensure that the client has an auto-connect function. Otherwise, you will permanently lose the data connection in case of interruptions.
- TCP Port
Specifies the TCP port on which the server listens for incoming connection requests. The default value is 10110. Use only ports greater than 1024, as ports below 1024 are reserved for specific applications. The maximum value is 65535.
- Max TCP Clients
Specifies the maximum number of clients allowed to connect to the TCP server. The default value is 6.
Note
Please note that a high number of clients can place a heavy load on the CPU. Therefore, ensure that no more than 6 clients can connect to the server at any one time. Otherwise, data processing may be impaired, or the device may become unresponsive.
- NMEA0183 Out
On- NMEA0183 data is output on the TCP port.Off- No NMEA0183 data is output on the TCP port.
- NMEA0183 In
On- NMEA0183 data is received on the TCP port.Off- No NMEA0183 data is being received on the TCP port.
- To NMEA2000
On- Data on the TCP port is transmitted according to NMEA2000 (gateway function)Off- Data on the TCP port is not transmitted according to NMEA2000
The next two settings configure the NMEA Read Filter and NMEA Write Filter for reading and writing on the TCP port. Only NMEA0183 data can be filtered. It is possible to separately configure whether AIS position signals are processed. The available filter types are “Whitelist” and “Blacklist”.
- NMEA Read Filter
Aison- Incoming AIS data at the USB interface is processed.Aisoff- Incoming AIS data at the USB interface is not processed.Blacklist- The filter uses a blacklist. The flagged telegrams will not be processed.Whitelist- The filter works with a whitelist. Only the listed telegrams are processed.
- NMEA Write Filter
Aison- AIS data to be sent via the USB interface is being processed.Aisoff- AIS data to be sent via the USB interface will not be processed.Blacklist- The filter uses a blacklist. The flagged telegrams will not be processed.Whitelist- The filter works with a whitelist. Only the listed telegrams are processed.
The input field is used to enter the short identifiers of the NMEA0183 telegrams; multiple entries are separated by commas ,. The following short identifiers can be used:
DBK, DBS, DBT, DPT, GGA, GLL, GSA, GSV, HDM, HDT, MTW, MWD, MWV, RMB, RMC, ROT, RSA, VHW, VTG, VWR, XDR, XTE, ZDA
The exact meaning of the abbreviations is explained in hier.
- Seasmart Out
SeaSmart allows you to translate NMEA2000 data into NMEA0183 telegrams. When you activate SeaSmart, all NMEA2000 data is output and tunneled via NMEA0183 telegrams. The data is transmitted in binary form within an NMEA0183 telegram. This allows you to transfer NMEA2000 data from one OBP60 (TCP server) to another OBP60 (TCP client) over Wi-Fi. Ensure that SeaSmart is also activated on the receiving end.
On- The TCP server can send and receive Seasmart data.Off- Seasmart is not supported by the TCP server
Config - TCP Client
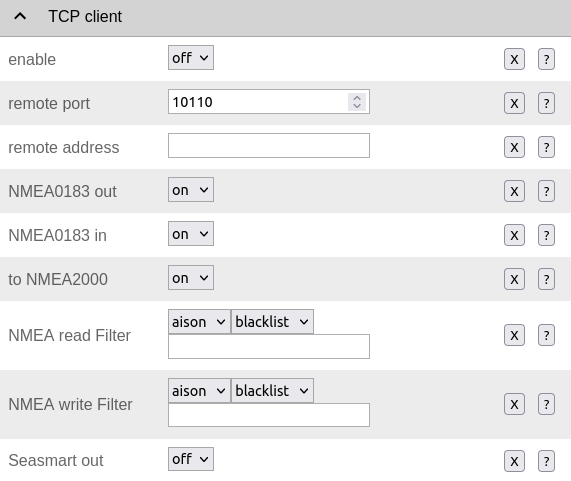
Here you configure the settings for operating the OPB60 as a TCP client. The OPB60 can exchange data with a TCP server in this mode, both reading and writing. The OPB60 actively connects to the TCP server via a TCP port and can then exchange data. The TCP client mode includes an auto-connect feature to automatically re-establish the connection after a connection interruption.
- Enable
On- TCP client mode is enabled in the OBP60Off- TCP client mode is disabled
- Remote Port
Specifies the TCP port over which data will be exchanged with a TCP server. The default value is 10110. For data exchange between a TCP server and a TCP client to occur, the TCP client must use the same port that the TCP server uses for communication. Only use ports greater than 1024, as ports below 1024 are reserved for specific applications. The maximum value is 65535.
- Remote Address
The <Remote Address> is the address of the TCP server on the Wi-Fi network with which you want to exchange data. You can use an IP address such as 192.168.15.1 or an MDNS hostname such as OBP60V2.local.
Warning
If you want to exchange data between two OBP60 devices via Wi-Fi, both devices must be on the same wireless network and have different system names. Your access points must be in the same IP address range but have different device addresses. One device must be configured as a TCP server and the other as a TCP client. These settings are configured under Config - System. Failure to follow these instructions may result in Wi-Fi data traffic disruptions and you may lose access to the devices’ web configuration interfaces.
- NMEA0183 Out
On- NMEA0183 data is output on the TCP port.Off- No NMEA0183 data is output on the TCP port.
- NMEA0183 In
On- NMEA0183 data is received on the TCP port.Off- No NMEA0183 data is being received on the TCP port.
- To NMEA2000
On- Data on the TCP port is transmitted according to NMEA2000 (gateway function)Off- Data on the TCP port is not transmitted according to NMEA2000
The next two settings configure the NMEA Read Filter and NMEA Write Filter for reading and writing on the TCP port. Only NMEA0183 data can be filtered. It is possible to separately configure whether AIS position signals are processed. Whitelist and blacklist filters are available.
- NMEA Read Filter
Aison- Incoming AIS data at the USB interface is processed.Aisoff- Incoming AIS data at the USB interface is not processed.Blacklist- The filter uses a blacklist. The flagged telegrams will not be processed.Whitelist- The filter works with a whitelist. Only the listed telegrams are processed.
- NMEA Write Filter
Aison- AIS data to be sent via the USB interface is being processed.Aisoff- AIS data to be sent via the USB interface will not be processed.Blacklist- The filter uses a blacklist. The flagged telegrams will not be processed.Whitelist- The filter works with a whitelist. Only the listed telegrams are processed.
The input field is used to enter the short identifiers of the NMEA0183 telegrams; multiple entries are separated by commas ,. The following short identifiers can be used:
DBK, DBS, DBT, DPT, GGA, GLL, GSA, GSV, HDM, HDT, MTW, MWD, MWV, RMB, RMC, ROT, RSA, VHW, VTG, VWR, XDR, XTE, ZDA
The exact meaning of the abbreviations is explained in hier.
- SeaSmart Out
SeaSmart allows you to translate NMEA2000 data into NMEA0183 telegrams. When you activate SeaSmart, all NMEA2000 data is output and tunneled via NMEA0183 telegrams. The data is transmitted in binary form within an NMEA0183 telegram. This allows you to transfer NMEA2000 data from one OBP60 (TCP server) to another OBP60 (TCP client) via Wi-Fi. Ensure that SeaSmart is also activated on the receiving end.
On- The TCP server can send and receive SeaSmart data.Off- SeaSmart is not supported by the TCP server
Config - WiFi Client
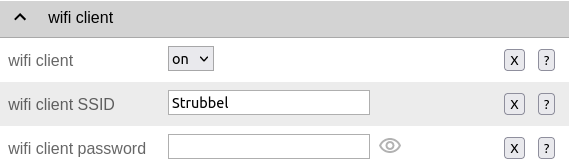
The OBP60 can be operated as a WiFi access point or as a WiFi client. In this mode, the OBP60 can join another WiFi network and exchange data. This allows you to integrate the OBP60 into your existing onboard WiFi system. The WiFi client mode includes an auto-connect feature to automatically reconnect after connection interruptions.
- WiFi Client
On- WiFi client mode is enabledOff- WiFi client mode is not supported
- WiFi Client SSID
Enter a Wi-Fi network name here, for example, the name of your ship’s Wi-Fi. Any character from the ASCII character set can be used as the name.
- WiFi Client Pasword
Enter the Wi-Fi password for the SSID mentioned above here. Any character from the ASCII character set can be used as the password. As you type, the password will be hidden with asterisks
*****. Clicking the eye icon will display the password in plain text.
Hint
If you are having trouble connecting to other Wi-Fi networks, check if the network name or password contains special characters. In some situations, special characters or excessively long passwords can cause connection problems. Try changing the network name or password. Sometimes restarting your onboard router, to whose Wi-Fi network you are trying to connect the OPB60, also helps.
Config - OBP Settings
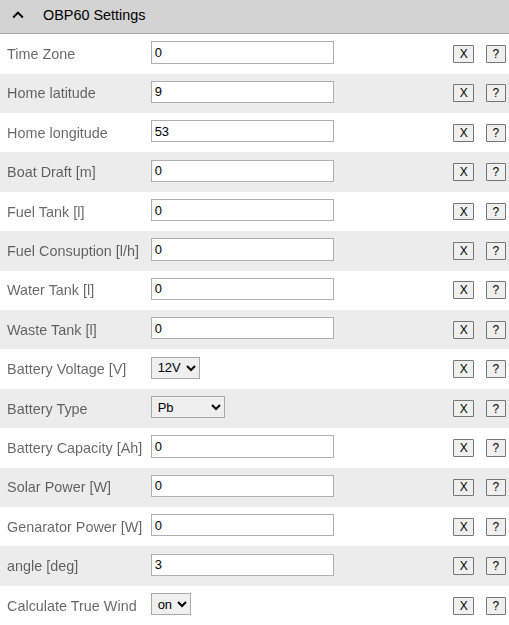
On the OBP60 Settings page, you can configure settings specific to your boat, in which the OBP60 is installed. The entered values are used, for example, to provide an approximate range estimate for water, fuel, and battery. Please enter the values for your boat as accurately as possible, paying attention to the corresponding units. These settings are used to display various operating states on the OPB60 in graphs.
Warning
Keep in mind that the range estimate provided by the internal voltage sensor should only be considered a guideline. Particularly with AGM and LiFePO4 battery types, you should expect greater inaccuracies. Observe and verify the results under real-world conditions before relying on the displayed values.
- Time Zone
The time zone can be set in the range of -12 and +14 hours via Time Zone.
Most settings should be self-explanatory. Unless you are using solar panels, leave the Solar Power value at 0. Generator Power refers to an electric generator operating on the boat. This could be an alternator, a wind generator, a towed generator, or another auxiliary generator. The power ratings for Solar Power and Generator Power are needed to visualize the energy flows.
- Calculate True Wind
If the boat sensors do not provide true wind data, you can select to calculate this data from the apparent wind data and a few other data types. The AWA and AWS data types are required for this calculation. STW or, alternatively, SOG is used for boat speed. To determine the boat’s current orientation, the following data is used in this order, if available: (1) HDT, (2) HDM+VAR, (3) HDM, (4) COG, if valid. Drift is not included in the calculation.
On- If not present, the data types TWD (True Wind Direction), TWA (True Wind Angle), and TWS (True Wind Speed) are calculated. Additionally, AWD (Apparent Wind Direction) is determined.Off- No true wind data is calculated. If the boat sensors provide relevant data, it will of course be used.
Note
The calculated true wind data can be displayed on all data pages where relevant. On the Data page of the web browser, the true wind data is only visible if it is provided by boat sensors. Calculated wind data is not displayed there.
Config - OBP Units
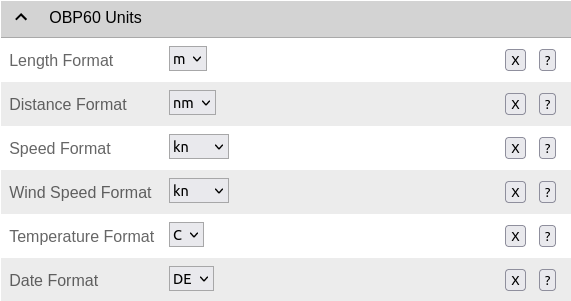
The unit settings are configured under OBP Units. Different units can be used for the respective physical quantities.
- Date Format
The Date Format option allows you to customize the date output format.
DE- German date format31.12.2024GB- British date format31/12/2024US- US-Datumformat12/31/2024
Config - OBP Hardware
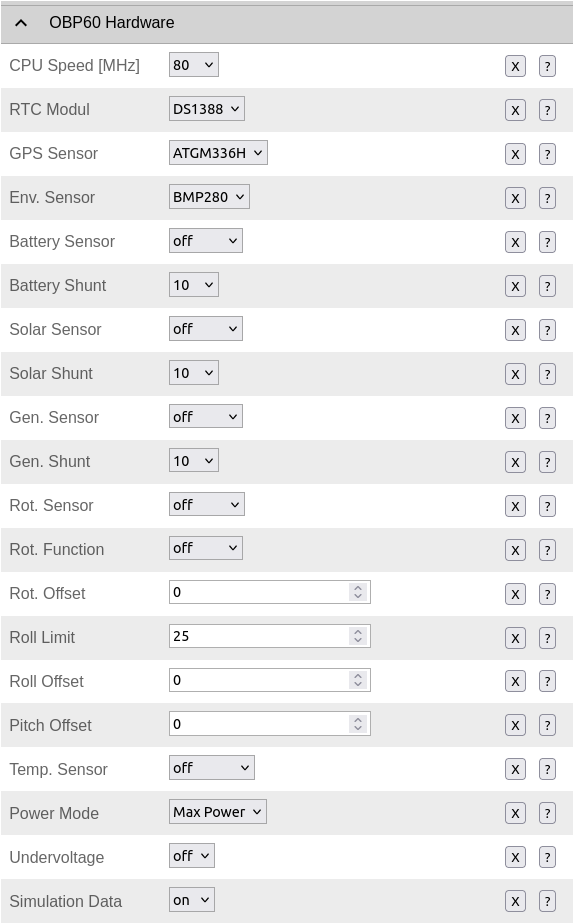
Under Hardware, all settings relating to the OPB60’s built-in hardware or external add-on hardware are configured. The default settings correspond to the minimum settings for an OPB60 device. Depending on the installed hardware, different sensors and functions may be used.
- CPU Speed
CPU clock speed. The clock speed is changed 1 minute after the boot process is complete.
80- 80 MHz160- 160 MHz240- 240 MHz
- RTC Module
Type of real-time clock
Off- No real-time clock is usedDS1388- DS1388 real-time clock (Default)
- GPS Sensor
Type of GPS Sensors
Off- No GPS sensor is usedNEO-6M- GPS Sensor NEO-6MNEO-M8N- Higher-quality GPS sensor NEO-M8NATGM336H- GPS-Sensor ATGM336H (Default)
- Env. Sensor
Information about the environmental sensor used. Various sensors can be selected. The sensors are connected to the I2C bus. Internal OBP60 device sensors or external sensors can be selected.
Off- No environmental sensor is usedBME280- Sensor for temperature, humidity and air pressureBMP280- Temperature and air pressure sensor (Default)BMP180- Sensor for temperature and air pressureBME085- Sensor for temperature and air pressureHTU21- Temperature and humidity sensorSHT21- Temperature and humidity sensor
- Battery Sensor
Here, sensors can be selected that are connected to the external I2C bus and read battery values.
Off- No sensor is usedINA219- Sensor for voltage 0…36V, current 0…500A and power, I2C address 0x40INA226- Sensor for voltage 0…36V, current 0…500A and power, I2C address 0x41
- Battery Shunt
Here you can select the shunt used to measure the battery current. Only shunts with a voltage drop of 75 mV at maximum current can be used. This information can be found on the shunt itself.
10- Shunt for 10A50- Shunt for 50A100- Shunt for 100A200- Shunt for 200A300- Shunt for 300A400- Shunt for 400A500- Shunt for 500A
- Solar Sensor
Here, sensors can be selected that are connected to the external I2C bus and read solar values.
Off- No sensor is usedINA219- Sensor for voltage 0…36V, current 0…500A and power, I2C address 0x41INA226- Sensor for voltage 0…36V, current 0…500A and power, I2C address 0x44
- Solar Shunt
Here you can select the shunt used to measure solar current. Only shunts with a voltage drop of 75 mV at maximum current can be used. This information can be found on the shunt itself.
10- Shunt for 10A50- Shunt for 50A100- Shunt for 100A200- Shunt for 200A300- Shunt for 300A400- Shunt for 400A500- Shunt for 500A
- Generator Sensor
Here, sensors can be selected that are connected to the external I2C bus and read generator values.
Off- No sensor is usedINA219- Sensor for voltage 0…36V, current 0…500A and power, I2C address 0x45INA226- Sensor for voltage 0…36V, current 0…500A and power, I2C address 0x45
- Solar Shunt
Here you can select the shunt used to measure solar current. Only shunts with a voltage drop of 75 mV at maximum current can be used. This information can be found on the shunt itself.
10- Shunt for 10A50- Shunt for 50A100- Shunt for 100A200- Shunt for 200A300- Shunt for 300A400- Shunt for 400A500- Shunt for 500A
- Rot. Sensor
The sensor for angle measurement, located on the external I2C bus, can be selected via Rot.Sensor.
Off- No sensor is usedAS5600- Magnetic sensor for angle measurement from 0° to 360° without end stop, I2C address 0x36
- Rot. Function
Function of the angle sensor
Rudder- Angle sensor for rudder positionWind- Angle sensor for wind directionMast- Angle sensor for mast alignment on rotatable mastsKeel- Angle sensor for keel inclinationTrim- Angle sensor for trim tabs or foilsBoom- Angle sensor for large tree
- Rot. Offset
Angle sensor offset. This allows the zero point of external angle sensors on the I2C bus to be corrected.
- Roll Limit
Roll Limit specifies the maximum permissible lateral tilt angle for the boat’s rolling. Under real-world conditions, 20 degrees is a realistic limit.
- Roll Offset
Offset of the tilt angle sensor. This allows the zero point of the angle sensor to be corrected for the lateral roll of your boat.
- Pitch Offset
Offset of the angle sensor for pitch. This allows the zero point of the angle sensor for the pitch of your boat to be corrected.
- Temp Sensor
Here you can select the sensor type used on the 1-Wire bus. Up to 8 sensors are supported on the 1-Wire bus.
Off- No sensor is usedDS18B20- Temperature sensor -10…+85°C (1…8 sensors)
- Power Mode
The Power Mode refers to the type of power supply used for the OBP60.
Max Power- All power supplies are switched on. In this state, the device is at its most powerful and can experience the highest power consumption.Only 5.0V- Only the additional power supply for 5.0 V is switched on.Min Power- Only the power supplies that provide the minimum functions are switched on. This results in the lowest power consumption. The bus systems, GPS, external 5V power supply, backlight, and buzzer are switched off. The display, buttons, RTC, and BMP280 environmental sensor are switched on.
Module |
Max Power [W] |
Min Power [W] |
|---|---|---|
CPU ESP32-S3 |
On |
On |
E-Paper Display |
On |
On |
Touch buttons |
On |
On |
Real-time clock RTC |
On |
On |
Sensor BMP280 |
On |
On |
1Wire |
On |
On |
Flash-LED |
On |
Off |
Backlight |
On |
Off |
Buzzer |
On |
Off |
GPS |
On |
Off |
Bussysteme N2k, 0183 |
On |
Off |
External 5V power supply |
On |
Off |
Table: Active Assemblies OBP60 V2.1
Components |
Max Power [W] |
Min Power [W] |
|---|---|---|
CPU 240 MHz, WiFi, AP |
1.78 |
1.30 |
CPU 160 MHz, WiFi, AP |
1.68 |
1.20 |
CPU 80 MHz, WiFi, AP |
1.58 |
1.13 |
CPU 240 MHz, WiFi |
1.16 |
0.70 |
CPU 160 MHz, WiFi |
1.07 |
0.60 |
CPU 80 MHz, WiFi |
0.96 |
0.53 |
External 5V power supply |
0.83 |
0.00 |
Tab.: Stromverbrauch OBP60 V2.1 (AP - Access Point)
Depending on the color and power of the backlight, additional power consumption will occur.
RGB LED lighting |
LED 100% [W] |
LED 50% [W] |
|---|---|---|
LED root |
0.24 |
0.11 |
Green LED |
0.24 |
0.11 |
LED blue |
0.24 |
0.11 |
LED weiss |
0.61 |
0.32 |
Table: Power consumption of the LED backlight
- Undervoltage
Undervoltage detection. If an undervoltage below 9 V is detected, the OBP60 can be automatically deactivated to prevent deep discharge of the on-board battery. In critical situations, the OBP60 can remain functional even with an undervoltage as low as 7 V if the undervoltage protection is deactivated. Undervoltage protection is enabled by default. If an undervoltage occurs while enabled, the OBP60 is deactivated and put into deep sleep mode. The message Undervoltage appears on the display. This state can only be changed by completely switching the power supply off and on again.
On- The undervoltage protection is activatedOff- The undervoltage protection is switched off.
Hint
If you want to power the OBP60 via USB, the undervoltage detection must be switched off, otherwise the device will switch off automatically.
- Simulation Data
Simulation Data allows you to simulate bus and sensor data. This function is useful when you want to test the functionality of the device in its removed state, without any connected buses or sensors. The device then operates in demo mode.
On- Sensor data is replaced by simulation dataOff- Live sensor data is used
Warning
Keep in mind that simulation data can be misinterpreted as live data. Only use simulation data when you do not need the OBP60 for navigation, and switch back to live data after use by exiting simulation mode.
Config - OBP Calibrations
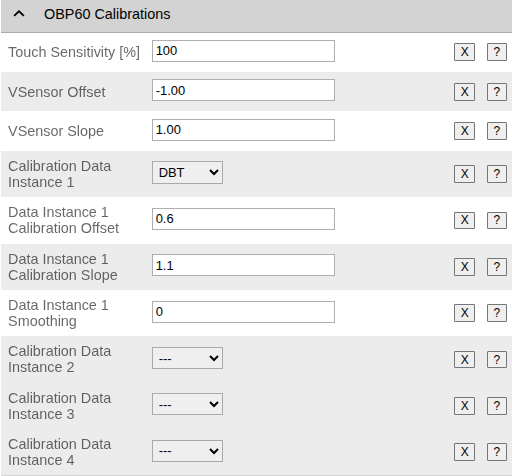
On the Calibrations page, calibration settings can be configured. This allows you to correct inaccuracies in certain measured values. Depending on the sensor, the correction can be performed using either a linear or quadratic correction.
- Touch Sensitivity
Key sensitivity setting: 0…100%. 0% means minimum sensitivity. 100% means maximum sensitivity.
- VSensor Offset
Offset of the correction function of the OBP60’s internal voltage sensor
- VSensor Slope
Slope of the correction function of the OBP60’s internal voltage sensor
- Calibration Data Instance [1..4]
Select up to four boot data types to be calibrated. The available data types appear when you open the drop-down list. Once you have selected a data type, the configuration parameters described below appear. Selecting
---disables calibration for that data type.
Currently, the following boot data types can be selected for calibration: AWA AWS COG DBS DBT HDM HDT PRPOS RPOS SOG STW TWA TWS TWD WTemp. Calibration of XDR data types is not yet possible.
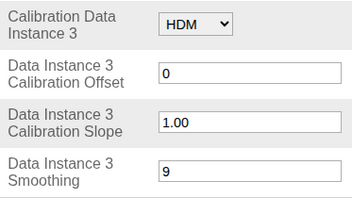
- Data Instance [1..4] Calibration Offset
Offset of the correction function for the selected data type
- Data Instance [1..4] Calibration Slope
Slope of the correction function for the selected data type.
- Data Instance [1..4] Smoothing
This applies smoothing or attenuation to the respective data type. A setting in the range [0..10] is possible.
0means “no smoothing”,10achieves maximum smoothing.
Attention
The default slope for each calibration value is 1. If 0 is entered here, every data value will also be set to 0. The default for the configuration parameters Offset and Smoothing is 0.
The Exponential Smoothing Algorithm is used for smoothing, and its strength can be adjusted via a parameter (values between 0 and 10). The new smoothed value s is calculated from the current measurement x, the previous smoothed value, and the weighting factor a.
On the configuration page, the value a is not entered directly, but rather the auxiliary parameter k, where the setting k=0 results in no damping (i.e. a=1), and values for k greater than 0 are calculated as follows:
This illustrates how different values of this parameter affect a signal: The first figure shows how a single outlier is suppressed with different settings. The second figure shows how a jump in the input data is transformed into a slower increase. In practice, a compromise must be made here so that, on the one hand, short-term fluctuations are effectively dampened, and on the other hand, actual changes do not take too long to become visible.
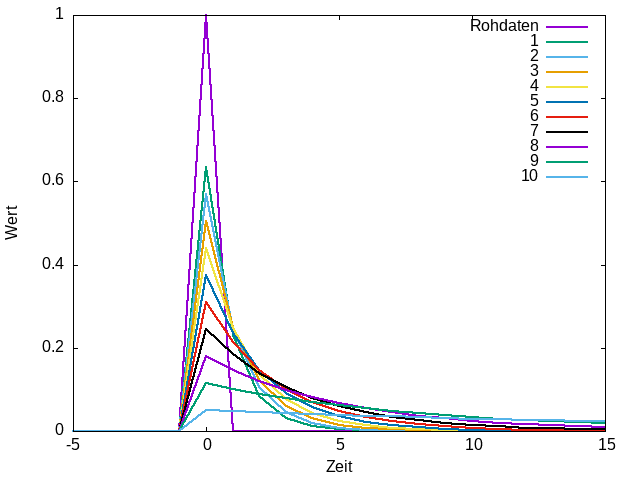
Fig.: Damping effect on outliers
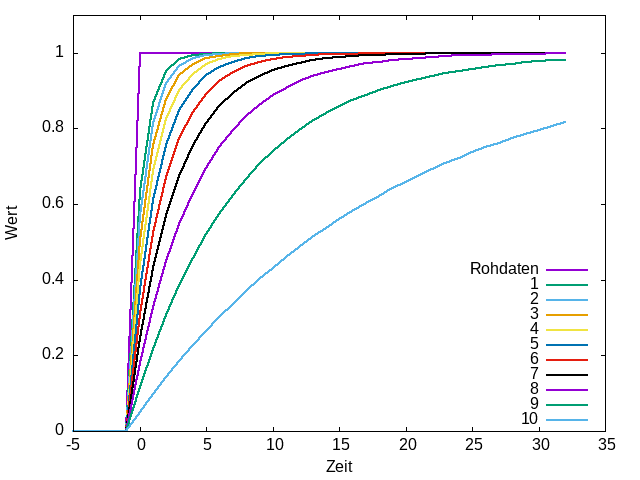
Fig.: Damping of rapid, abrupt changes
The x-axis of the diagrams shows the number of data updates, i.e., they correspond to a time axis in seconds if the measurement is updated once per second.
Note
The calibration of the selected boot data types is visible on all selected display pages. The web browser’s Data page displays the uncalibrated readings of the respective sensor. This can help evaluate the configured calibration.
Config - OBP Display
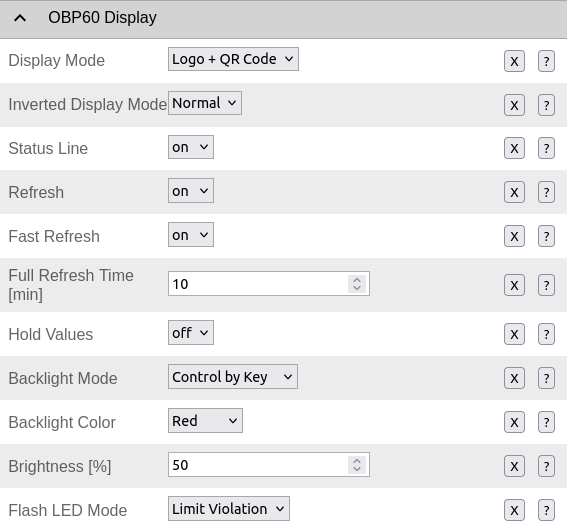
The Display section contains all settings that affect the display.
- Display Mode
The Display Mode determines how the display behaves immediately after being switched on.
Logo + QR Code- The logo and QR code for WiFi access are displayed.Logo- Only the logo is displayed.White Screen- A white page is displayed.Off- The display is deactivated; it is not used for display.
- Inverted Display Mode
Normal- The screen content is displayed in black on a white background.Inverse- The screen content is displayed in white on a black background.
- Status Line
On- The status bar is displayed at the top of the screen.Off- The status bar is disabled.
- Refresh
On- Auto-refresh of the screen content is enabled. This prevents ghosting when switching pages. A full refresh of the e-paper display is performed. An additional full refresh occurs automatically every 10 minutes.Off- Auto-refresh is disabled
Note
The appearance of ghost images depends on the OBP60’s display temperature. At lower temperatures, ghost images are more noticeable, and the display reacts more slowly than at higher temperatures. For the first five minutes after powering on, a full refresh is performed every minute to allow the display to acclimatize. In extremely bright sunlight, the display’s contrast may be lost, with black areas appearing gray. This is not a defect. After a full refresh, the display recovers, and the contrast is fully restored.
- Fast Refresh
On- With Fast Refresh enabled, a full refresh is performed faster. Fewer black-to-white transitions are made.Off- With Fast Refresh disabled, a full refresh is performed more slowly because more black-to-white transitions are made.
- Full Refresh Time
The Full Refresh Time setting allows you to define how often a full refresh should occur. Full refreshes are important for the e-paper display because, after a certain period of partial updates, the display needs a full refresh to recover and maintain its functionality. During a full refresh, the display contrast is fully restored.
Note
Depending on the type of display, strong sunlight can cause a loss of contrast after some time. To minimize this effect, Fast Refresh should be deactivated and the Full Refresh Time set to 1 minute. This significantly improves the display’s recovery time.
The following table serves as a guide on how to adjust the display settings:
Parameter |
Temp <= 20°C |
Temp > 20°C |
Direct sunlight |
|---|---|---|---|
Refresh |
Off |
On |
On |
Fast Refresh |
On |
On |
Off |
Full Refresh Time |
10 Min |
5 Min |
1 Min |
- Hold Values
On- Display values are retained if the data connection is briefly interrupted and the data cannot be updated. This setting can be useful for TCP connections over WiFi.Off- Display values are not retained. If the data connection is interrupted for longer than 5 seconds, missing data is marked with---.
- Backlight Mode
Off- The backlight is permanently switched off.Control by Sun- Automatic switching of the lighting based on the position of the sunControl by Bus- Automatic switching of the lighting via the bus using NMEA2000Control by Time- Switching the lighting at a predetermined time intervalControl by Key- Manual switching of the lighting via a sensor buttonOn- The backlight is permanently on.
- Backlight Color
The color of the backlight can be individually adjusted using 6 RGB LEDs.
Red- rotOrange- orangeYellow- yellowGreen- greenBlue- blueAqua- waterViolet- violetWhite- white (highest power consumption)
- Brightness
The brightness of the RGB LED backlight can be adjusted between 20% and 100% using the Brightness setting. The default value is 50%, which means very little power is required for the backlight. This brightness level is suitable for nighttime use and prevents the light from being too bright.
Hint
For longer night drives, a red backlight is recommended, set to a moderate brightness of, for example, 50%. With red light, the eye doesn’t have to constantly adjust to changing light conditions. This allows you to read the display at night without any visual impairment.
Note
- The higher the brightness of the backlight is set, the more power is consumed. White backlighting consumes the most power, as all three colors of the RGB LED are used to generate white light. Pure primary colors like red, green, and blue consume the least power. With mixed colors, the RGB LEDs are driven at different intensities, resulting in higher power consumption than with the primary colors. Here are two examples:
100% White - 2 W
50%, Rot - 0.2W
Flash LED Mode
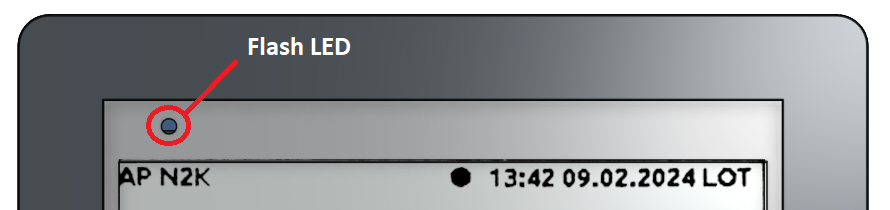
The flash LED is located in the upper left corner above the e-paper display and indicates various states of the OBP60. The LED can display different colors, each with a different meaning depending on its use.
Off- The flash LED is permanently switched off.
Bus Data- When bus data arrives, the LED briefly lights up blue.
GPS Fix Lost- A continuously red flashing LED indicates that the GPS fix has been lost. The GPS data is invalid.
Limit Violation- A flashing red LED indicates that a limit has been exceeded or fallen below.
The flashing LED shines at maximum brightness, making it easily visible even in bright sunlight. The meaning of the colors is as follows:
Red - Alarm when limit value is exceeded
Green - Confirmation of status changes (e.g., autopilot on/off)
Blue - Signaling of states (e.g. GPS reception, data transfer, etc.)
Config - OBP Buzzer
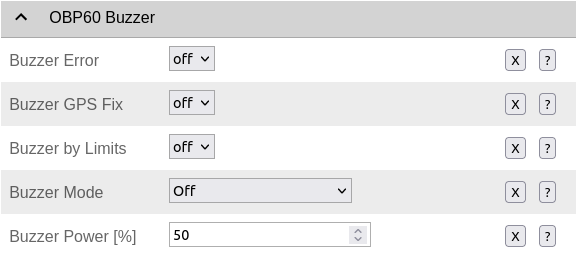
This section allows you to configure the buzzer’s functions. The buzzer serves to acoustically signal system states and malfunctions of the OBP60.
- Buzzer Error
On- The buzzer sounds in case of malfunctions and errors.Off- The function is disabled.
- Buzzer GPS Fix
On- The buzzer sounds when the GPS signal is lost.Off- The function is disabled.
- Buzzer by Limits
On- The buzzer sounds when the limit is exceeded.Off- The function is disabled.
- Buzzer Mode
Off- The buzzer is permanently switched off.Short Single Beep- A short single tone sounds when activated.Longer Single Beep- When activated, a longer single tone sounds.Beep until Confirmation- When activated, the buzzer will sound until it is deactivated by pressing any key.
- Buzzer Power
The Buzzer Power setting allows you to adjust the volume of the warning tone between 0 and 100%. This volume setting applies to all audio output.
Config - OBP Pages
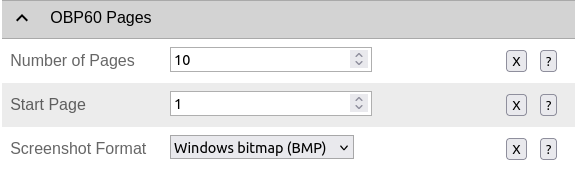
The configuration of the OPB60’s possible display pages is done on the Pages page. Here you specify how many display pages the OPB60 should show. You can also specify which display page should be shown when the device is switched on.
- Number of Pages
Here you set the maximum number of display pages. At least one display page must be defined; a maximum of 10 display pages can be activated.
- Start Page
This value determines which page should be displayed at startup. Only pages within the specified number of pages can be displayed.
- Screenshot Format
Specifies which image output format is used for screenshots. The following formats are available:
Compressed Image (GIF)- Compressed GIF filePortable Bitmap (PBM)- Binary image format without header (cannot be displayed in browser)Windows Bitmap (BMP)- Binary image format with headerA screenshot can be taken by visiting the following website:
Config - OBP Page X

The OBP60 offers up to 10 customizable pages. The amount of data displayed varies depending on the page. Some pages are freely definable, allowing you to select the content to be displayed. Others have predefined, non-editable content. Most numeric pages are editable, while graphical pages often display predefined content.
- Pages with editable content
OneValue - A single display value, numeric/graphical
TwoValue - Two display values, numeric/graphical
ThreeValue - Three numeric display values
FourValue - Four numeric display values
FourValue2 - Four display values (different arrangement vertical/horizontal)
WindRoseFlex - Displays wind direction (graphically on a wind rose) and wind speed, as well as 4 other freely configurable values. A button allows switching between true and apparent wind.
RollPitch - Graphical display of roll and pitch
- Pages with fixed content
Voltage - Display of the on-board voltage (xdrVBat)
WindPlot - Graphical display of wind data from the past 4-32 minutes (TWD, TWS, AWD, AWS)
WindRose - Display of wind data (AWA, AWS, TWD, TWS, DBT, STW)
DST810 - Display for depth, speed, log and water temperature (DBT, STW, Log, WTemp)
Clock - Graphic time display with sunrise and sunset, regatta timer (GPST, GPSD)
White Page - Blank white page to put the display into standby mode
BME280 - Display of environmental data such as temperature, air pressure and humidity (BME280 I2C)
Rudder - Graphical display of rudder position (RPOS)
Keel - Graphical display of keel position (AS5600 I2C)
Battery - Display of voltage, current and power (INA219, INA226 I2C)
Battery2 - Graphical display of battery charge level (INA219, INA226 I2C)
Solar - Graphical display of solar charge status (INA219, INA226 I2C)
Generator - Graphical display of generator charge status (INA219, INA226 I2C)
Digital Out - Graphical display of digital output states (Output module, Horter & Kalb I2C)
Note
Please note that all pages with static content require specific sensor values to display measurements. The availability of the necessary data can be checked under the Data tab.
For pages with dynamic content, the number of input fields available varies depending on the number of displayed values. These fields allow you to select the data to be displayed.
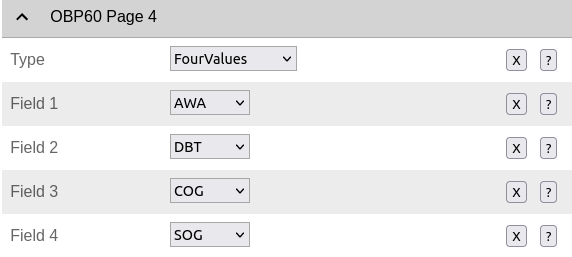
Fig.: Page with 4 display values
- Data pool of selectable data
ALT - Altitude, height above ground
AWA - Apparent Wind Angle, apparent wind direction relative to the boat
AWD - Apparent Wind Direction, apparent wind direction over ground
AWS - Apparent Wind Speed
BTW - Bearing To Waypoint, Angle to the current waypoint
COG - Course over Ground
DBS - Depth Below Surface
DBT - Depth Below Transducer, Depth below sensor
DEV - Deviation, course deviation
DTW - Distance To Waypoint, distance to the current waypoint
GPSD - GPS Date, GPS-Datum
GPDT - GPS Time, GPS time as UTC (Universal Time)
HDM - Magnetic Heading, magnetic course
HDT - Heading, true guiding course
HDOP - GPS accuracy in the horizontal plane
LAT - Latitude, geographical latitude
LON - Longitude, geographical altitude
Log - Log, Distance
MaxAws - Maximum Apparent Wind Speed, maximum relative wind speed since device start-up
MaxTws - Maximum True Wind Speed, maximum true wind speed since device start-up
PDOP - GPS accuracy across all 3 spatial axes
PRPOS - Secondary Rudder Deflection
ROT - Rotation, Drehrate
RPOS - Rudder Position, Main Rudder Deflection
SOG - Speed Over Ground
STW - Speed Through Water
SatInfo - Satellite Info, Number of visible satellites
TWA - True Wind Angle, true wind direction relative to the boat
TWD - True Wind Direction, true wind direction over ground
TWS - True Wind Speed
TZ - Time Zone
TripLog - Trip Log, Daily Distance Counter
VAR - Variation, deviation from the target rate
VDOP - GPS Accuracy in the Vertical
WPLat - Waypoint Latitude, geographical latitude of the waypoint
WPLon - Waypoint Longitude, geographical length of the waypoint
WTemp - Water Temperature
XTE - Cross Track Error, Course Error
XdrVBat - On-board voltage
OneValue
|
|
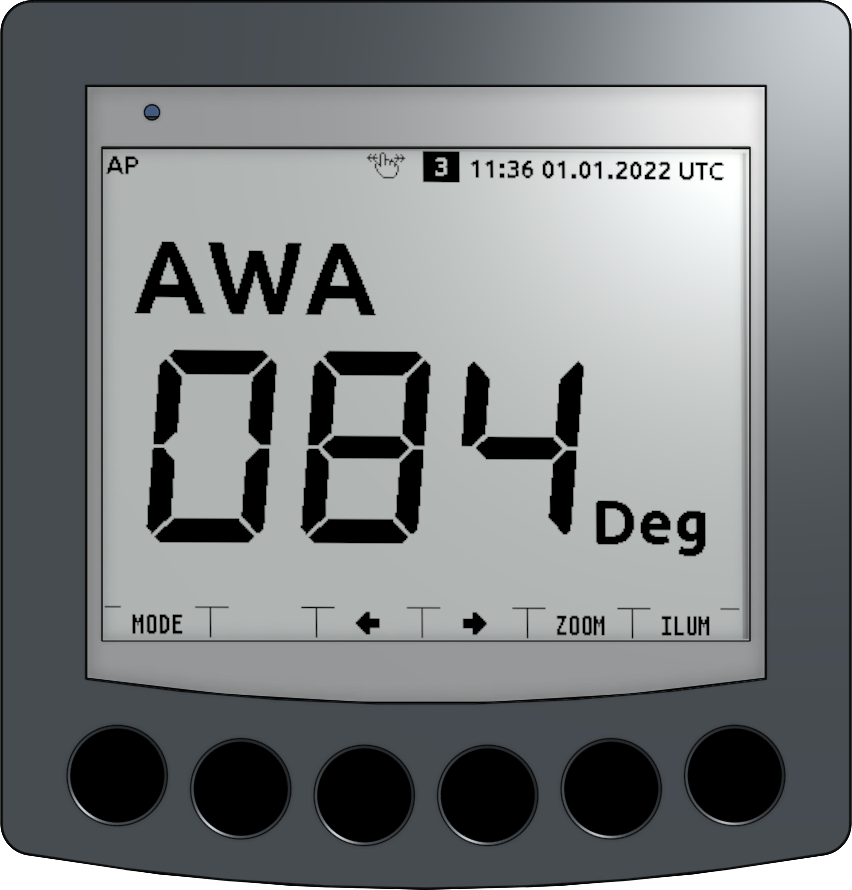
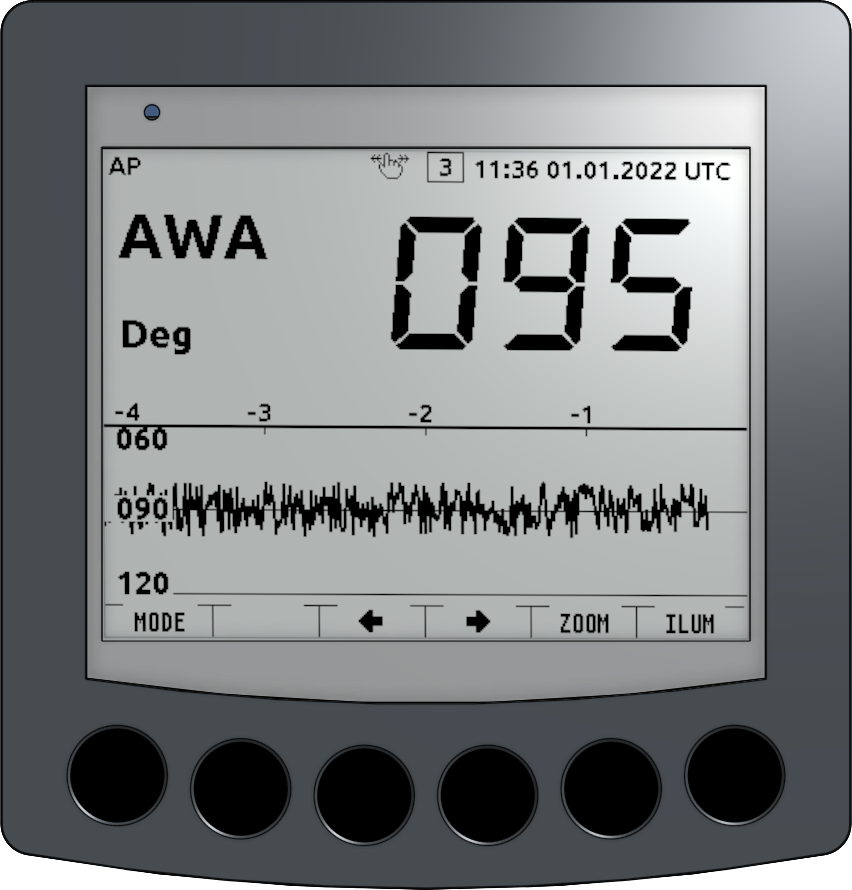
Image: OneValue advertisement
The OneValue display allows you to show any measurement value from the data pool. In addition to the measurement value, the short identifier and unit are displayed. The buttons have the following meanings:
[MODE]- Switching the display type
[<-]- Go to previous page
[->]- Switch to the next display page
[ZOOM]- Change in the time interval of the graph [4|8|12|16|32] in minutes
[ILUM]- Light on/off
For certain data types, a graphical display of the data history can be selected in addition to the numerical display using the [MODE] key. The display toggles between three different views:
Large-format numerical display of the current measured value
Display of the measured value in the upper half of the display and a graphical diagram showing the time course of the measured values in the lower half of the display.
Full-screen graphical display of the time course of the measured values with a small numerical representation of the current measured value.
The value axis is dynamically adjusted depending on the displayed data.
The graph can display the trend of the measured values over a selectable time interval. The time interval can be changed using the [ZOOM] button. Each press of the button advances the interval between [4|8|, 12|16|, and 32 minutes. The selected interval is indicated on the time axis. At a four-minute interval, a new data value is added every second. At longer intervals, new values are displayed only every 2-8 seconds.
Note
The graphical display is supported for the following data types: AWA, AWD, AWS, COG, DBS, DBT, DPT, HDM, HDT, ROT, SOG, STW, TWA, TWD, TWS, WTEMP. If a data type is selected for OneValue display that only allows a numeric display, the [MODE] and [ZOOM] keys will not be available.
TwoValue

|
|
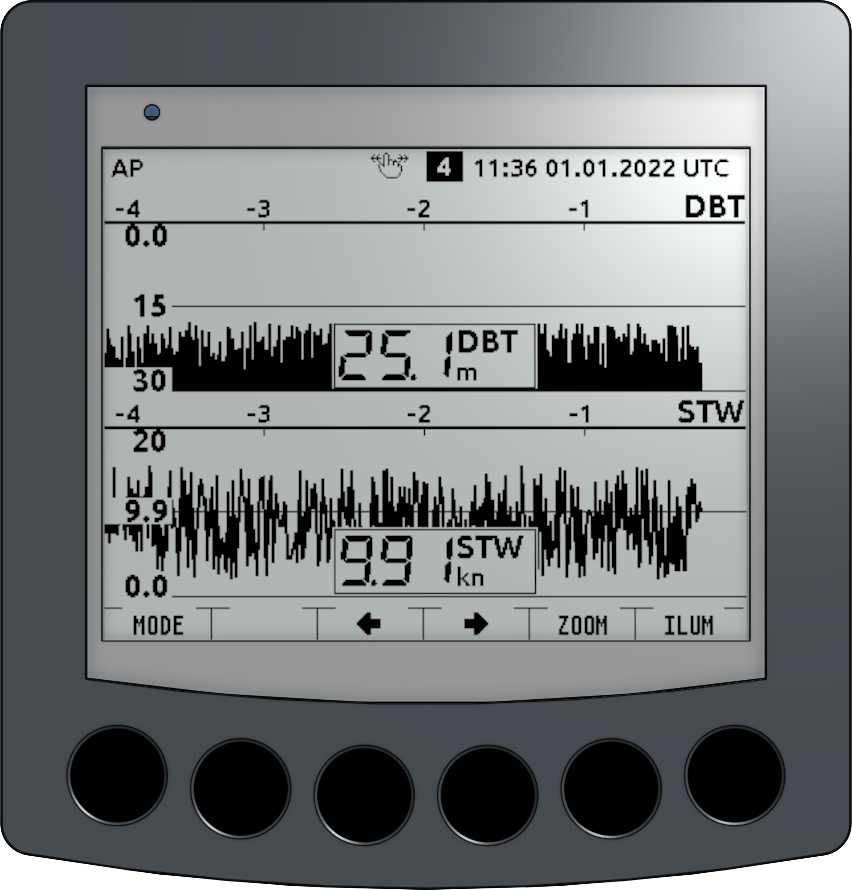
Image: TwoValue advertisement
The TwoValue display allows any two measured values from the data pool to be displayed vertically, one above the other. In addition to the measured values, their short names and units are also shown.
The other functions are identical to the OneValue display.
ThreeValue
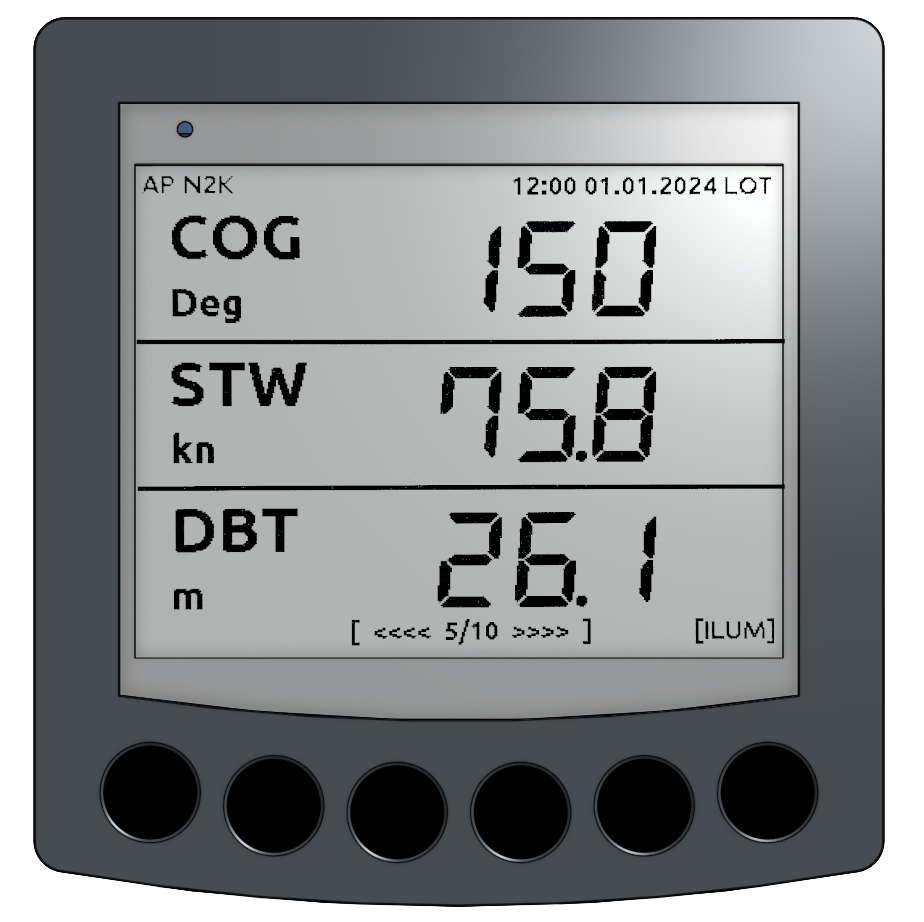
Image: ThreeValue advertisement
The ThreeValue display allows any three measured values from the data pool to be displayed vertically, one above the other. In addition to the measured values, their short names and units are also shown.
FourValue
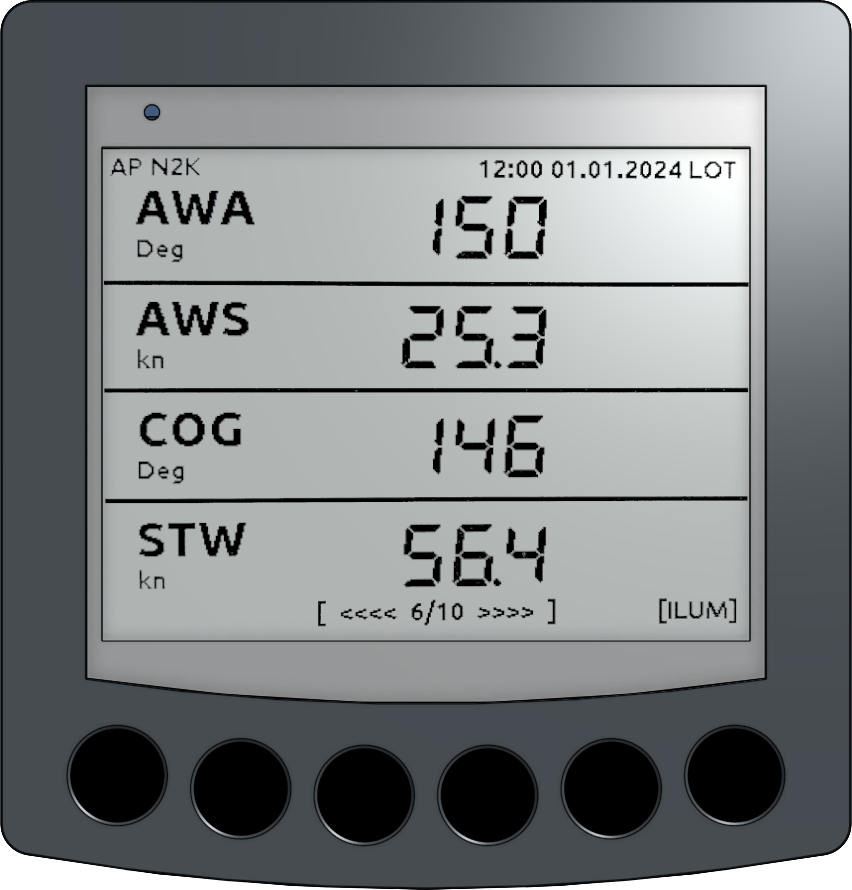
Image: FourValue advertisement
The ThreeValue display allows any four measured values from the data pool to be displayed vertically, one above the other. In addition to the measured values, their short names and units are also shown.
FourValue2
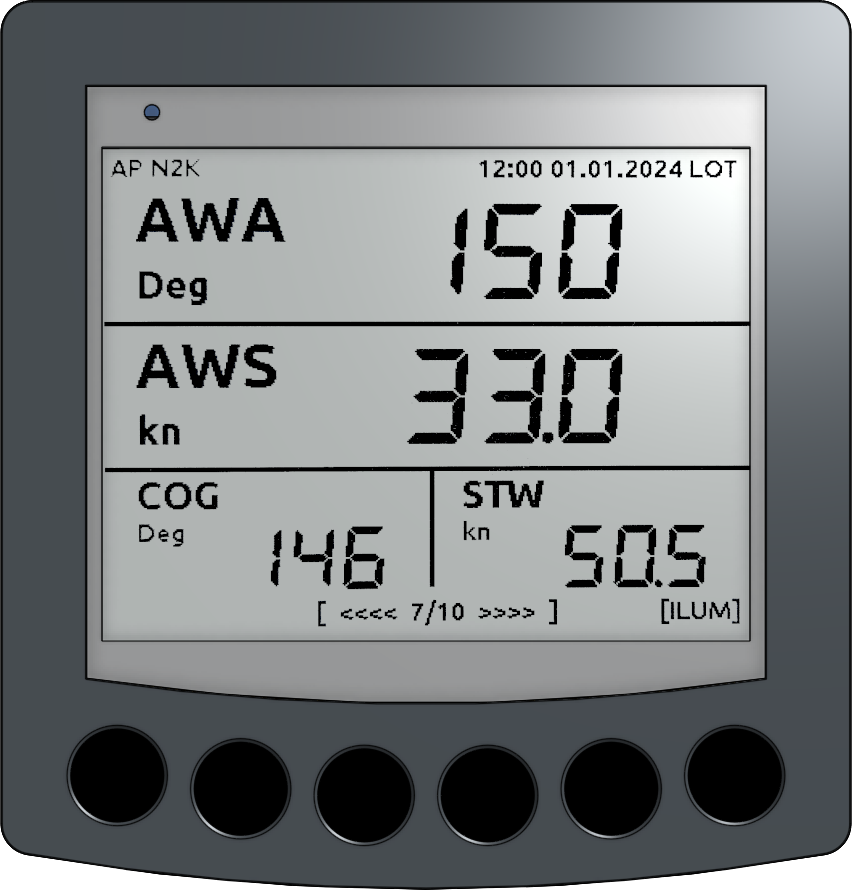
Image: FourValue advertisement
The FourValue display allows any four measurements from the data pool to be shown vertically, one above the other, and horizontally, side by side. Alongside the measurements, the short descriptions and units are displayed. This display corresponds to the older Raymarine ST60 TriData display, with the difference that any values can be shown. There is also the DST810 display page with fixed content, which shows the same measurements as the ST60 TriData.
DST810
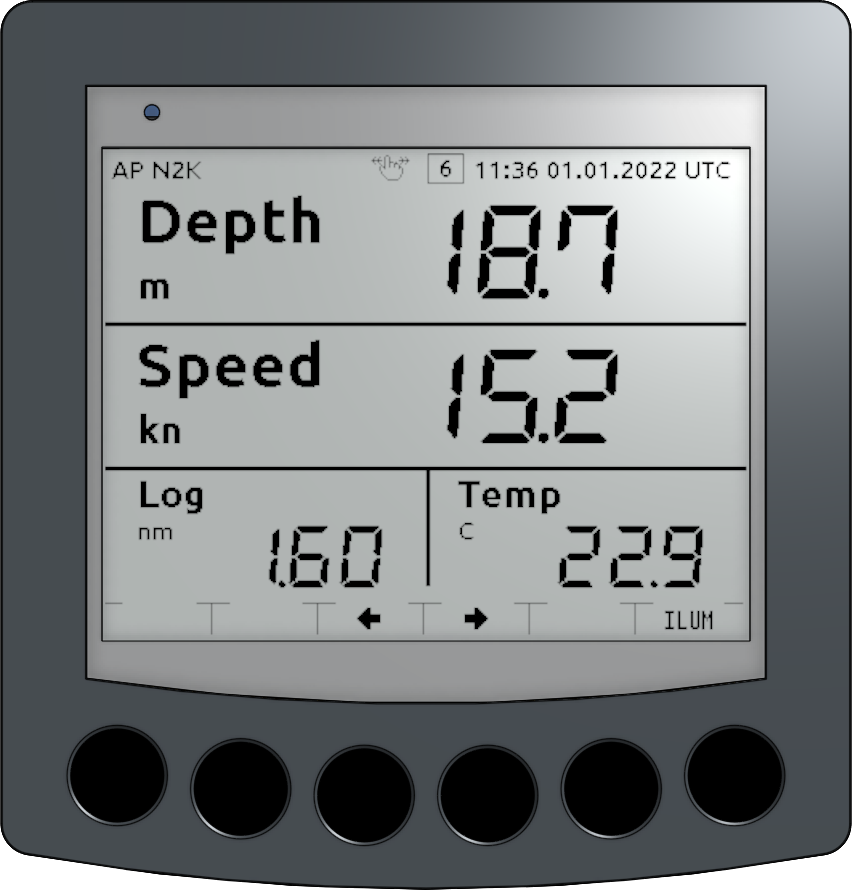
Fig.: Display DST810
The DST810 display shows speed through the water, depth, distance traveled, and water temperature. In addition to the measured values, the abbreviations and units are displayed. The display layout corresponds to the older version of the Raymarine ST60 TriData. Valid information must be present in the data pool for the data to be displayed. Besides the Airmar DST810, measurements from other sensor manufacturers that provide the same data or a portion thereof can also be displayed.
The display page requires the following measurements: DBT, STW, Log, WTemp
Voltage
|
|
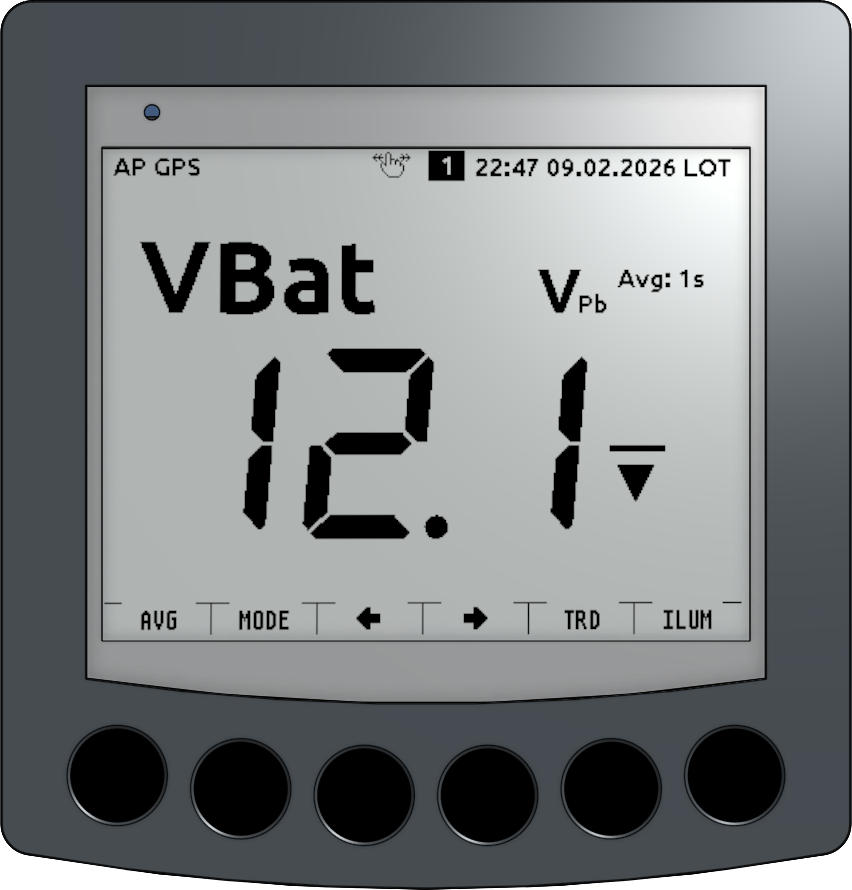
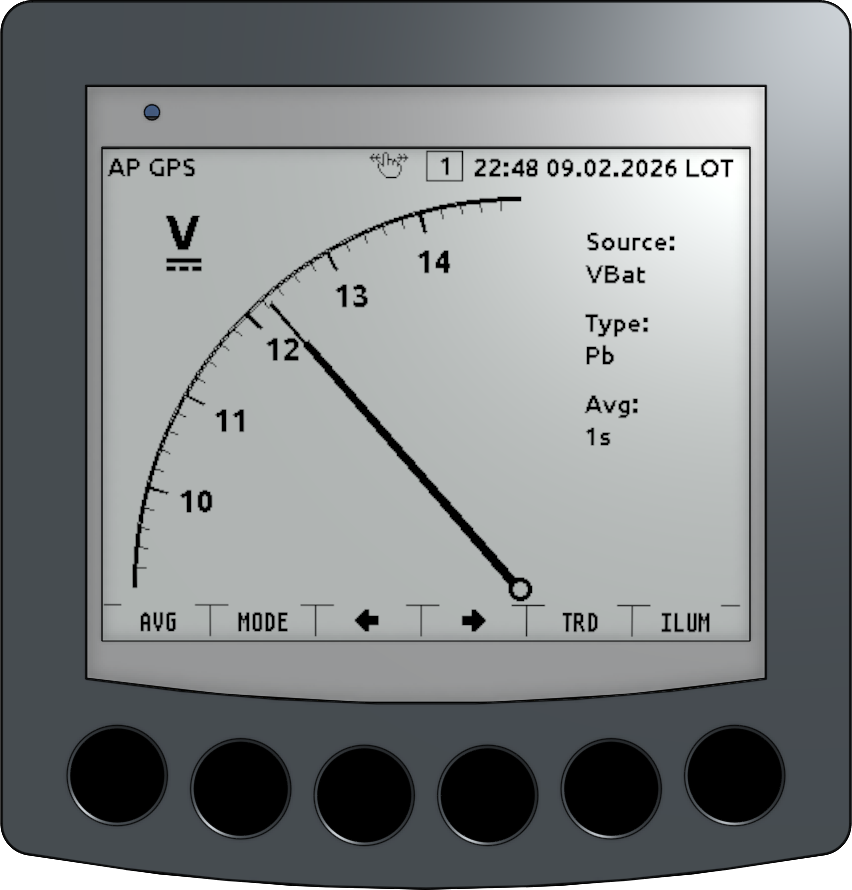
Fig.: Voltage display
The voltage display shows the battery supply voltage as provided at the CN2 input.
Note
Please note that the voltage reading may not exactly match the battery voltage. Voltage drops can occur due to line losses, and the measured value may be lower than the actual battery voltage.
A trend indicator shows the direction in which the voltage is moving. The battery type [Pb|AGM|Gel|LiFePo4] and the currently used averaging depth are displayed next to the unit “Volt”. The following functions can be accessed via the buttons.
[MODE]- Switching between analog and digital display
[AVG]- Setting the averaging depth in seconds [1|30|60|300]
[TRD]- Enable or disable trend display
The display page requires the following measurement values: xdrVBat
WindPlot
|
|
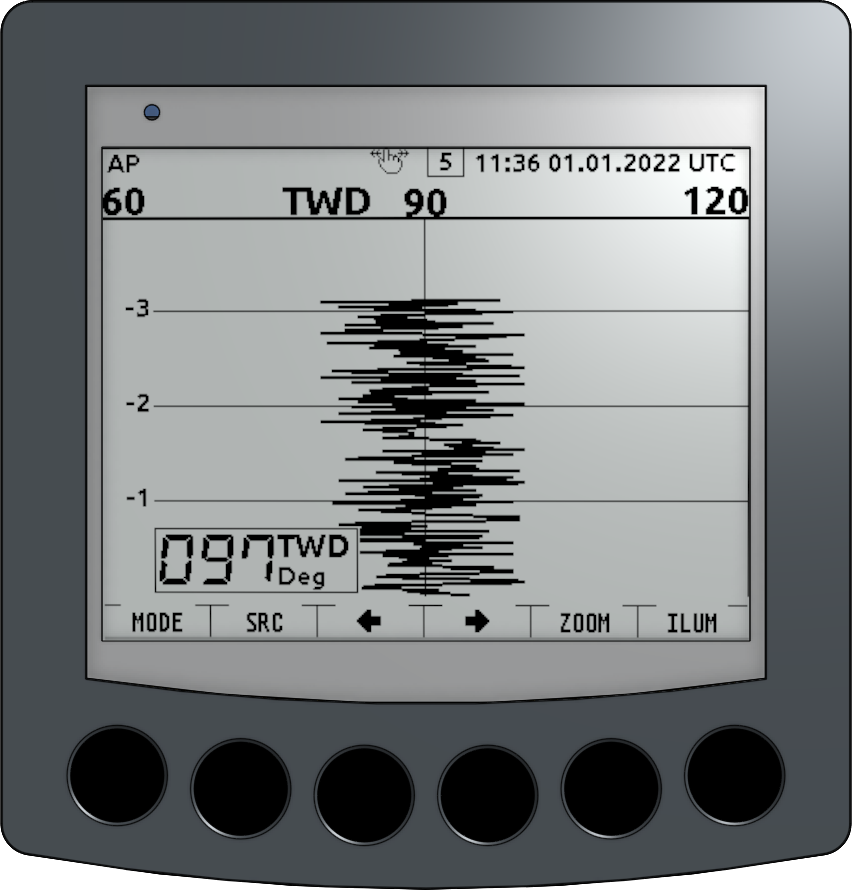
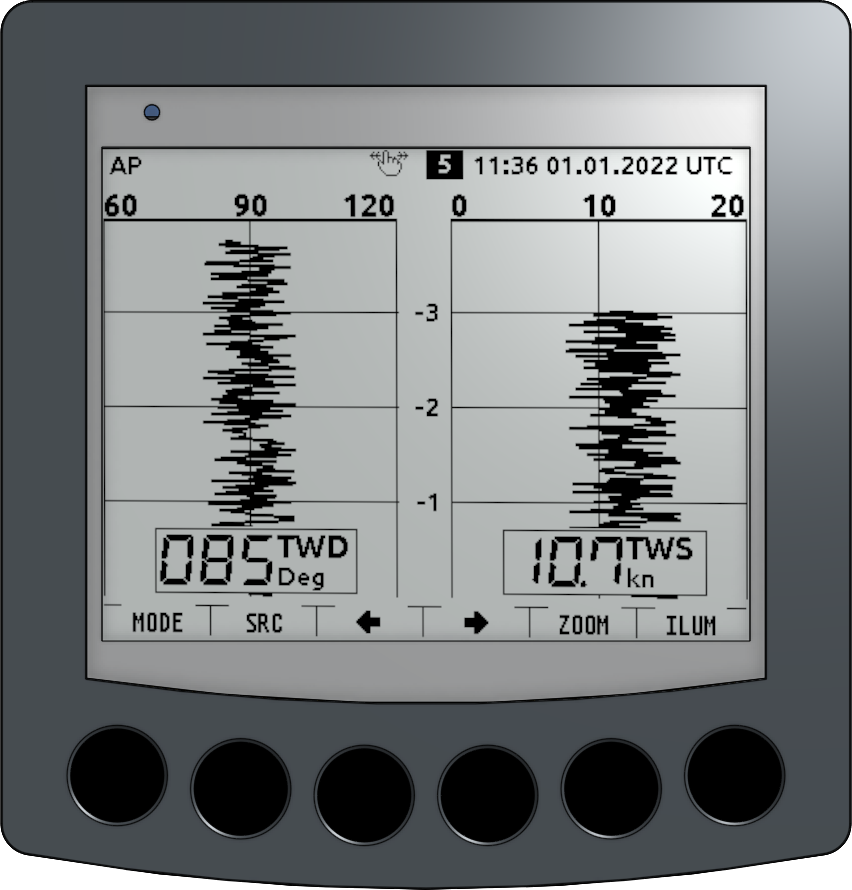
Fig.: WindPlot display
This page graphically displays the time course of wind data. The [MODE] key switches between three different line graphs:
Absolute wind direction (wind direction TWD/AWD)
Wind speed (wind speed TWS/AWS)
Combined display of wind direction and wind speed.
The value axis is dynamically adjusted depending on the displayed data. In addition to the graphical display of the wind data, the most recent value is also shown as a number.
The [SRC] key allows you to switch between displaying true and apparent wind data.
The graph can display the wind data over a selectable time interval. The time interval can be changed using the [ZOOM] key. Each press of the key advances the interval between [4, 8, 12, 16, 32] minutes. The selected interval is indicated on the time axis. At a four-minute interval, a new data value is added every second. At longer intervals, new values are displayed only every 2-8 seconds.
The display page requires the following measurements: TWD, TWS, AWS. The AWD value is calculated automatically if the AWA and AWS data sets are available.
Note
Switching between true and apparent wind data is only available on the OBP60. Since the OBP40 only has two buttons, the wind data type must be selected in the page definition configuration submenu WindPlot. The selection cannot be changed on the device itself.
WindRose
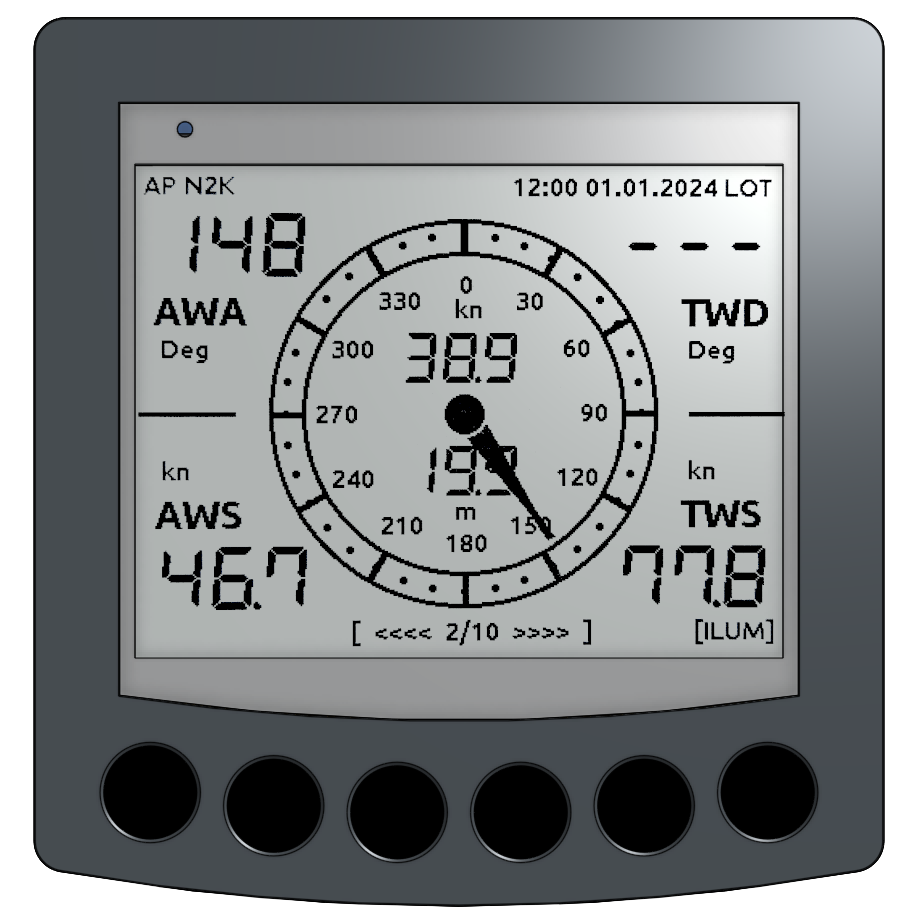
Fig.: Display of compass rose
The wind rose display shows wind data. The apparent wind data is shown on the left, and the true wind data on the right. The apparent wind data refers to the wind perceived on a moving vessel, resulting from the interaction of the true wind and the wind generated by the vessel’s movement. This is relative data perpendicular to the boat. The true wind data represents the wind conditions as measured on a stationary vessel. The wind angle is measured relative to the bow, and the wind direction is measured relative to true north.
The current speed through the water and the water depth below the sensor are displayed in the center of the compass rose.
The display page requires the following measurements: AWA, AWS, TWD, TWS, DBT, STW
WindRoseFlex
Fig.: WindroseFlex display
In this version of the WindRose display, the values to be shown can be freely selected. The first value is graphically represented as a direction on the wind rose; it makes sense to choose AWA or TWA here.
XTETrack
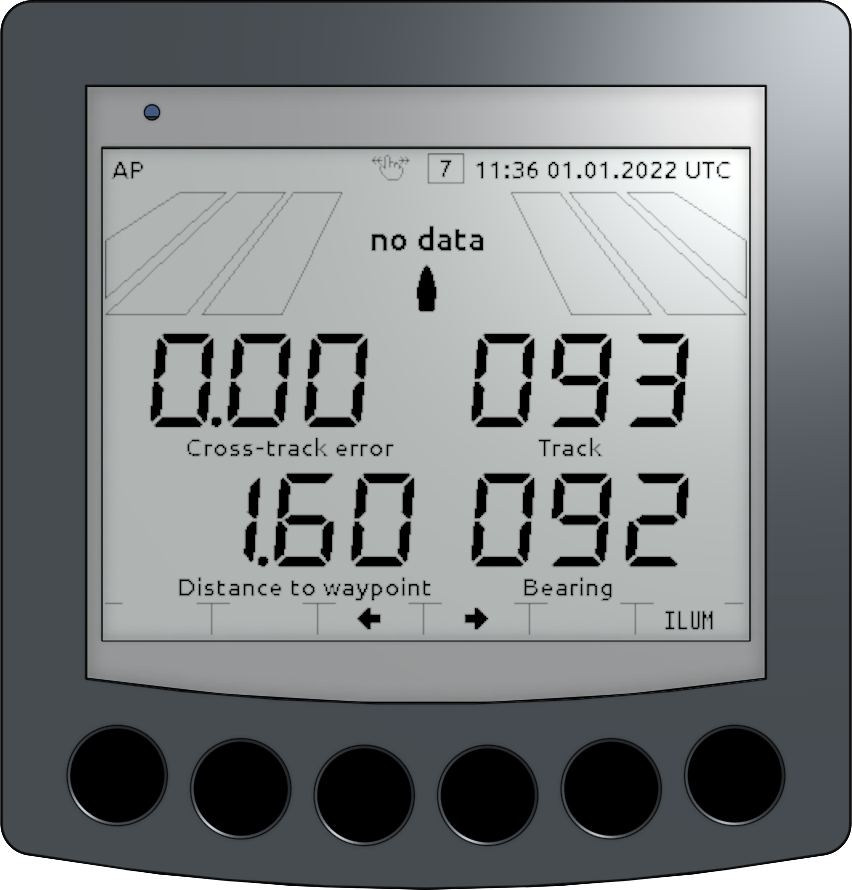
Image: XTETrack display
This display shows information about the course to the next waypoint when corresponding route and waypoint data is provided online by a plotter. Data is displayed for…
Cross-track error: current distance to the ideal waypoint line and position (port/starboard) from this line
Track: current price over ground
Distance to waypoint: Distance to the next waypoint
Bearing: current direction to the next waypoint
Waypoint name: if available
The current distance/position to the waypoint line is also visualized via “highway stripes”.
The display page requires the following measurements: XTE, COG, DTW, BTW
Compass
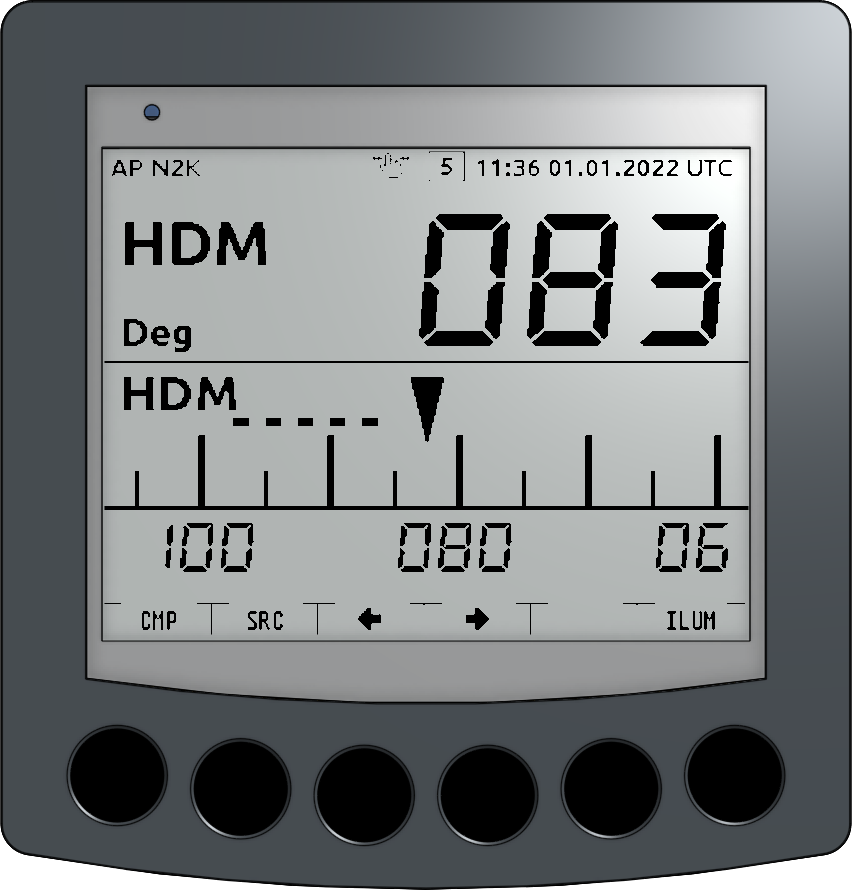
Image: Compass display
This display shows a rotating compass dial with a supplementary measurement above it. The compass dial moves according to the current heading. A dashed line to the left/right represents the last course change. The length of the line symbolizes the magnitude of the course change.
The
[CMP]button allows you to switch the compass display source between HDM, HDT and COG.The
[SRC]button allows you to switch the supplementary measurement value between HDM, HDT, COG, STW, SOG and DBS.
The display page requires the following measurements: HDM, HDT, COG, STW, SOG, DBS
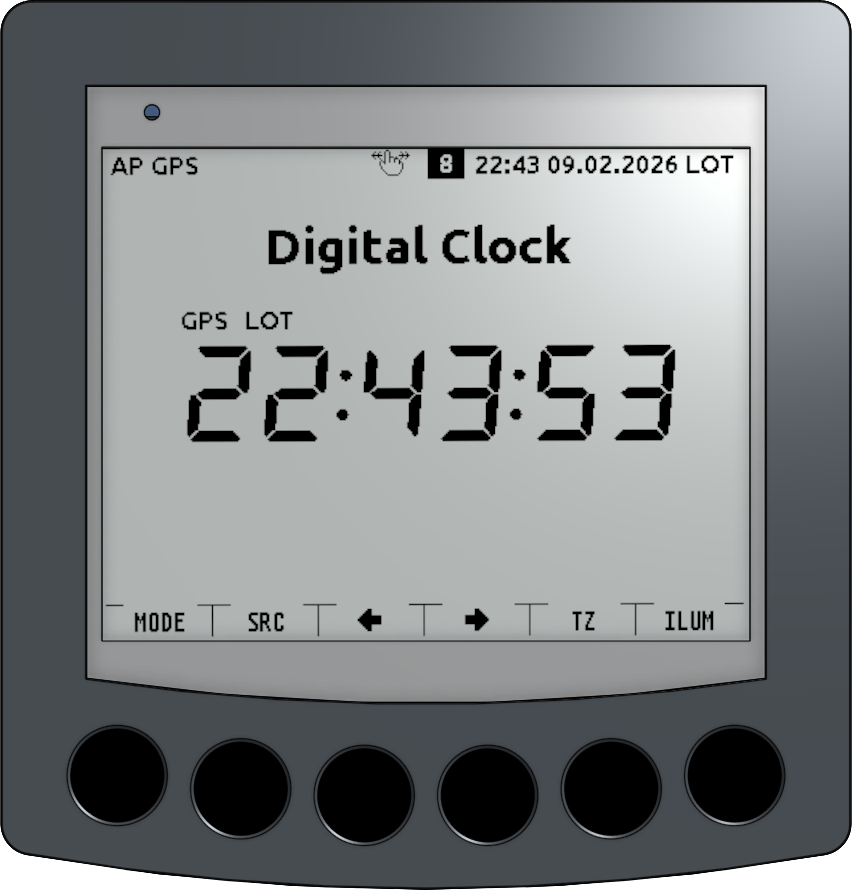
Clock
|
|
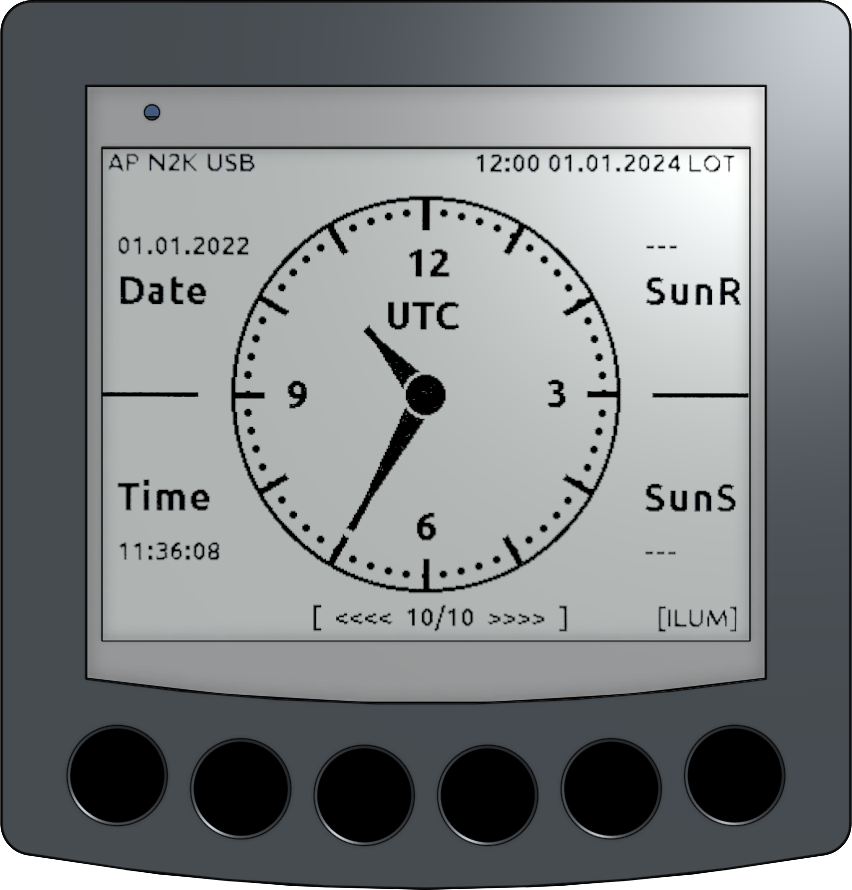
Fig.: Clock display
The clock display fulfills 3 display tasks:
Analog time
Digital time
Regatta hours
The keys have different meanings depending on the mode:
Analog and Digital Clocks
[MODE]- Switching the display type
[SRC]- Switching the time source [RTC|GPS]
[<-]- Go back to the previous page
[->]- Switch to the next display page
[TZ]- Time zone setting [LOT|UTC]
[ILUM]- Light on/off
The clock display shows the time, date, sunrise time, and sunset time. These values are primarily derived from GPS data. If no GPS signal is available, the internal Real Time Clock (RTC) can be used as the time source. Sunrise and sunset times are calculated based on the geographic location and correspond to the astronomical sunrise and sunset times. The time can be displayed as either UTC or local time (LOT). The time zone can be selected via the configuration page Config - OBP Settings. The time is automatically set using GPS time. Before using the OBP60, ensure that GPS reception is available so that the time can be set. The RTC time is synchronized with GPS time at regular intervals, ensuring that you have time information even when GPS reception is unavailable.
Note
If GPS data is unavailable, the time and date from the RTC (Real-Time Clock) are used. In this case, sunrise and sunset times are unavailable because the geographical location data is missing.
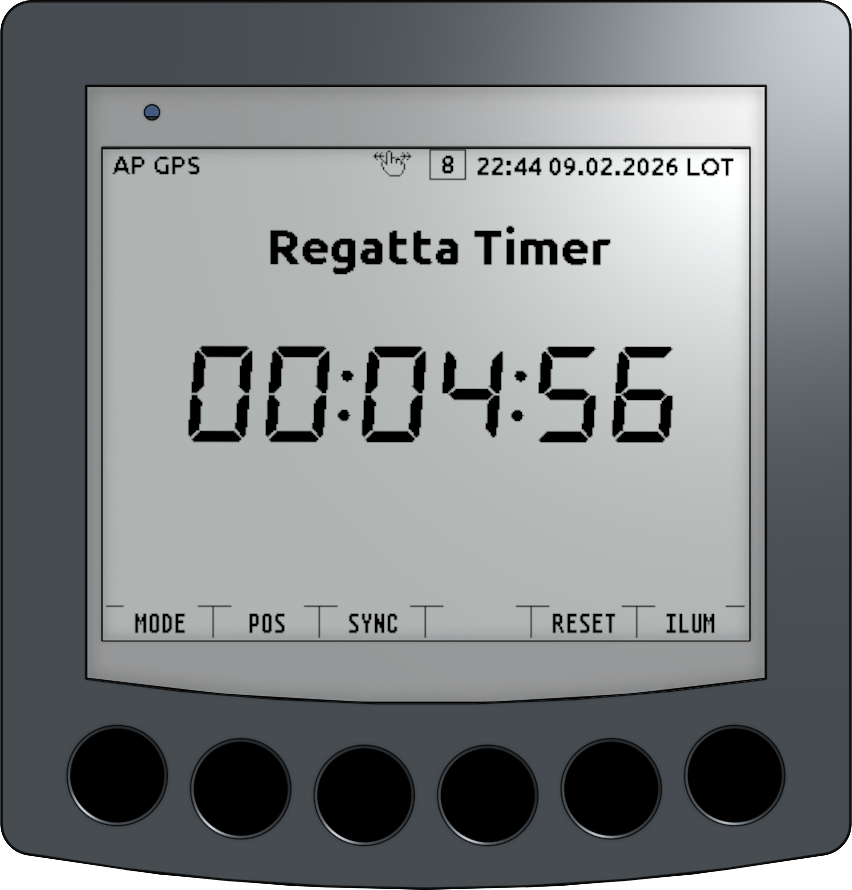
Fig.: Display of regatta timer
Regatta Hours
[MODE]- Switching the display type
[POS]- Switch between hour, minute, second for setting
[+][SYNC]- Increment of the display value or synchronization of the timer with a fixed time [4 min]
[-][ ]- Decrement of the display value
[START][RESET]- Start and reset of the timer
[ILUM]- Light on/off
The regatta timer is a countdown timer with special functions. The cursor for setting the time can be positioned at the desired digit using the [POS] button. The cursor is only visible when the timer is not running. The displayed values can be changed using [+] and [-] buttons. Once the timer is running, no further adjustments are possible, and the timer can be synchronized with a 4-minute pre-signal from the race management using the [SYNC] button. Pressing the [SYNC] button immediately sets the timer to 00:04:00, and the countdown continues. Stopping the countdown using the [RESET] button resets the time to its initial value, and the timer is ready to start again or can be adjusted if necessary. Audible signals sound at the following times before the countdown ends:
[60|50|]40|30|]20|10]S Short two-tone output
[5|4|3|2|]1]S Short single-tone output
[0]S Long monotone output
Once the countdown has finished, the timer jumps back to the starting time.
The display page requires the following values: GPST, GPSD
WhitePage
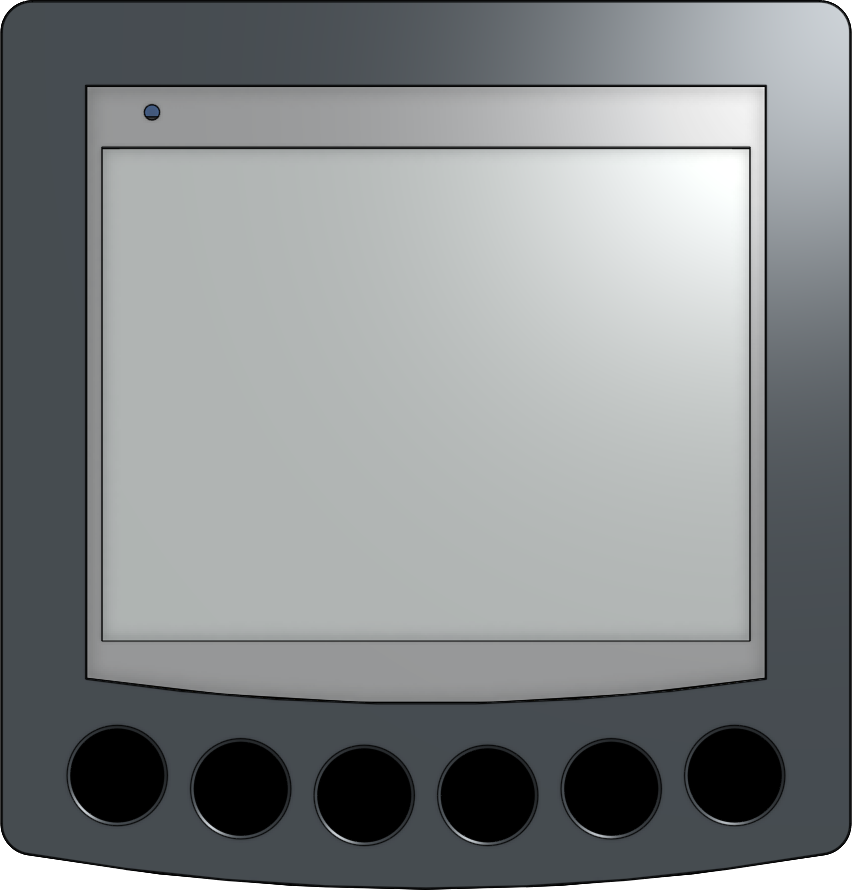
Image: WhitePage display
WhitePage is a display page that shows only a blank white page. This page can be used to selectively clear the screen content before switching off the device.
BME280
Fig.: BME280 display
The BME display shows the three measured values of air temperature, air pressure, and humidity from the BME280. For this to work, the BME280 must be connected to the external I2C bus and set to address 0x77.
Warning
Keep in mind that the external I2C bus uses a 5V signal level for SCL and SDA. Use modules that are tolerant of 5V, or use 5V to 3.3V level shifters for the SCL and SDA signals. Failure to do so may damage the external modules or cause them to malfunction.
A 5V compatible BME280 module is the GYBME electronic module:
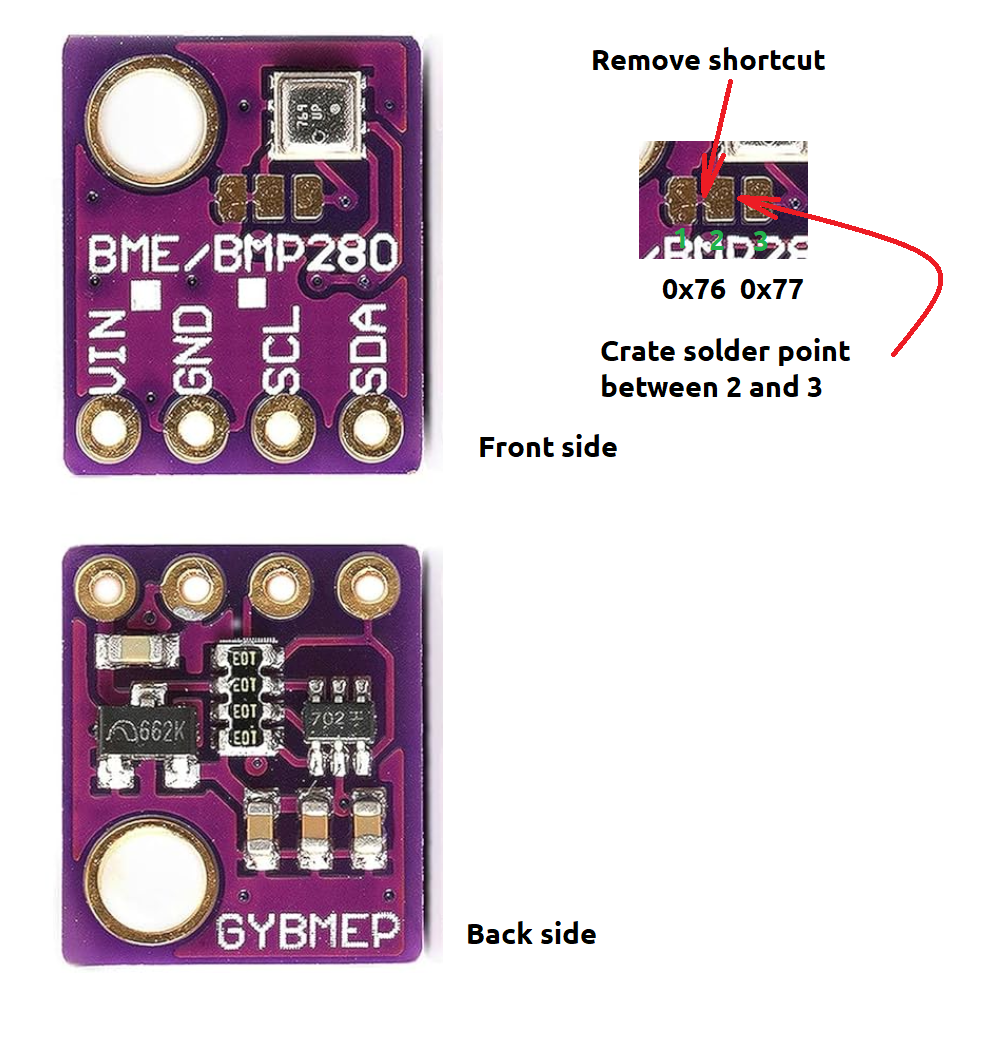
Fig.: BME280-Module
The measured values from the external sensor must be saved as XDR telegrams (see configuration page: XDR). The following mappings must be observed:
TAir - Air temperature
Pair - Air pressure
Hair - Humidity
Rudder
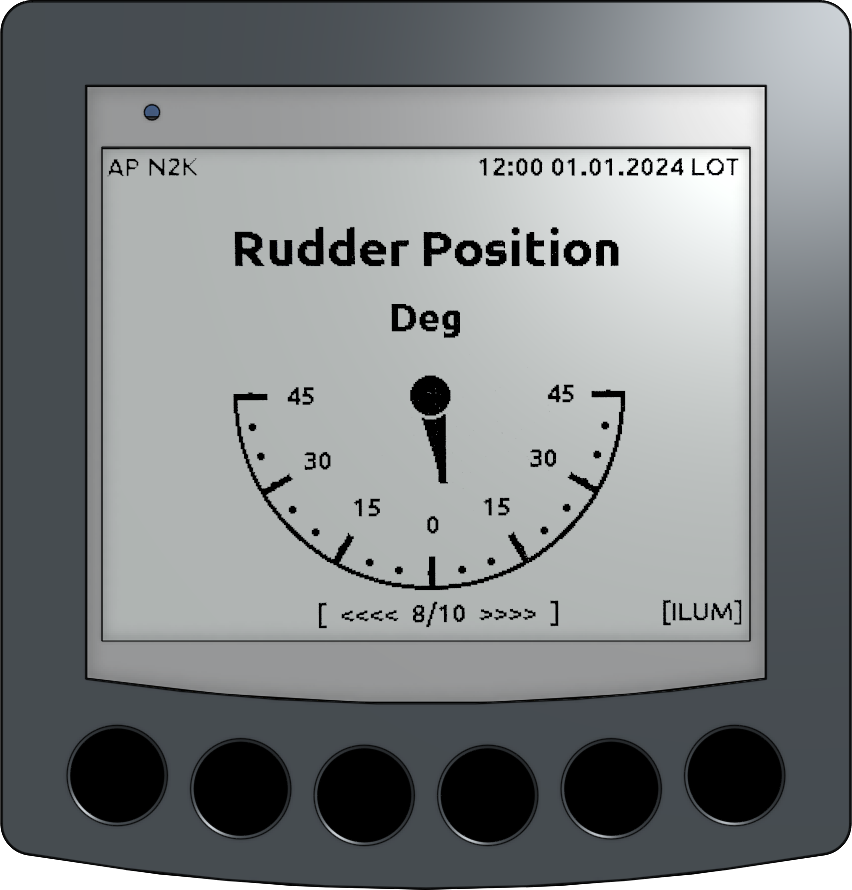
Fig.: Rudder display
The rudder indicator displays the rudder deflection. The rudder deflection can be graphically represented within a range of +/-45°. If no sensor readings for rudder deflection are available, the indicator is not visible.
Hint
The rudder display can be used for data from NMEA0183, NMEA2000 and an I2C rotation sensor.
The display page requires the following measurements: RPOS
Keel
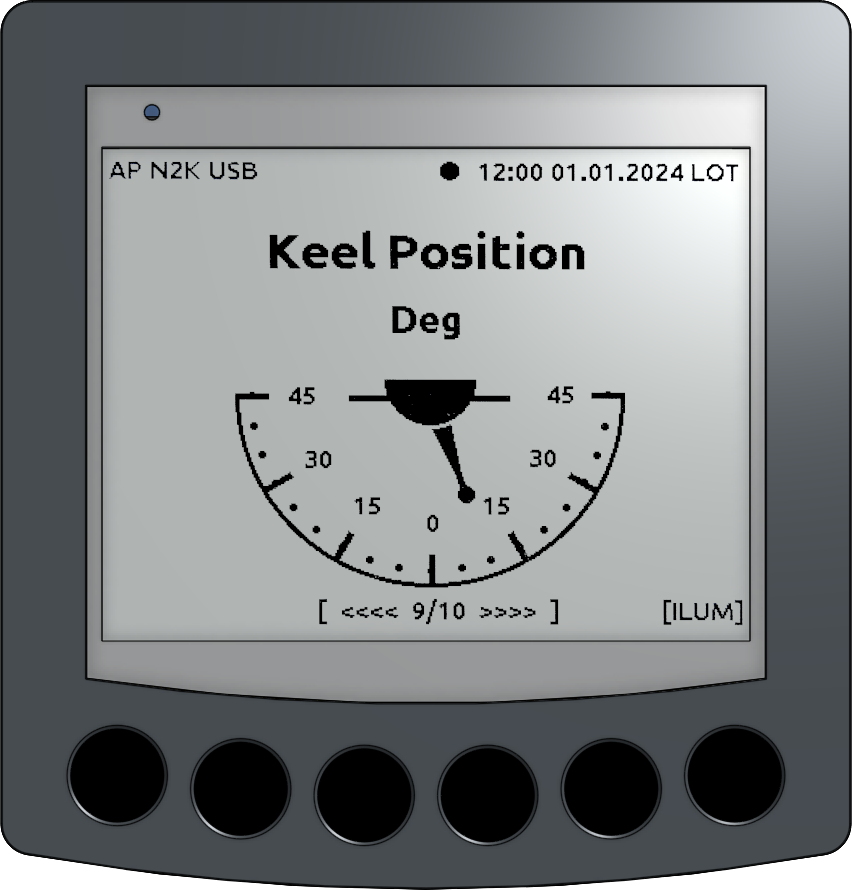
Fig.: Keel advertisement
The keel display shows the keel position of a canting keel. The keel position can be graphically represented within a range of +/-45°. If no sensor values are available for the keel position, the keel is not visible.
In order for the keel position to be displayed, a rotation sensor module AS5600 must be connected to the I2C bus and the sensor must be parameterized as keel sensor on the configuration page Config - OBP Hardware.
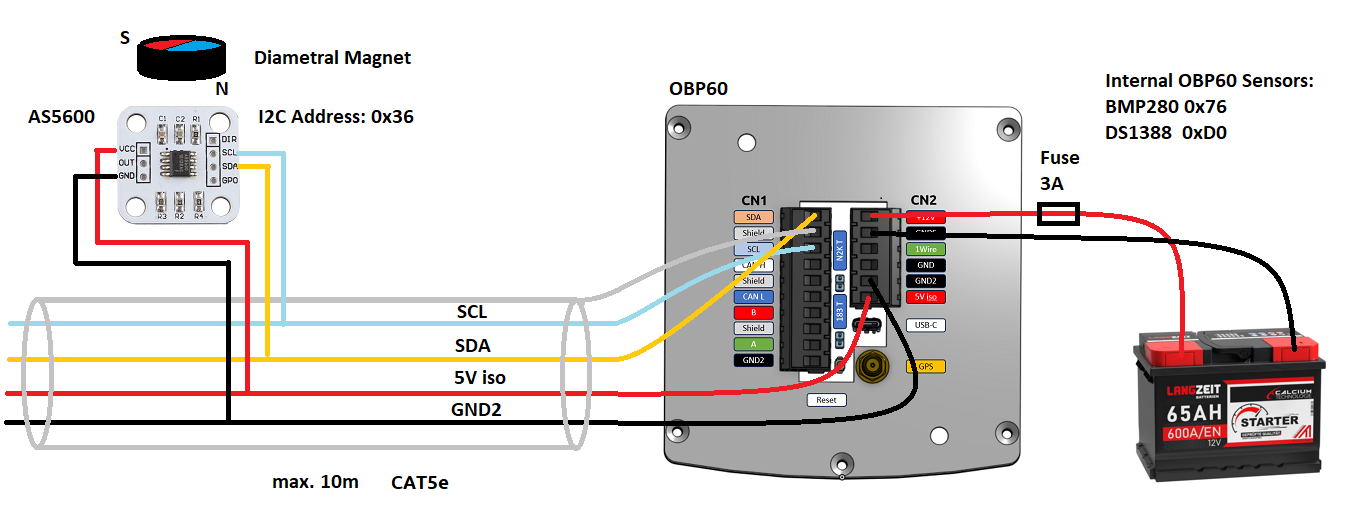
Fig.: AS5600 magnetic rotation sensor for displaying the keel position
Please also refer to the information in the chapters Data Exchange - I2C Bus and Bus Systems - I2C.
Hint
The keel indicator can only be used in conjunction with an I2C rotation sensor.
Navigation
|
|
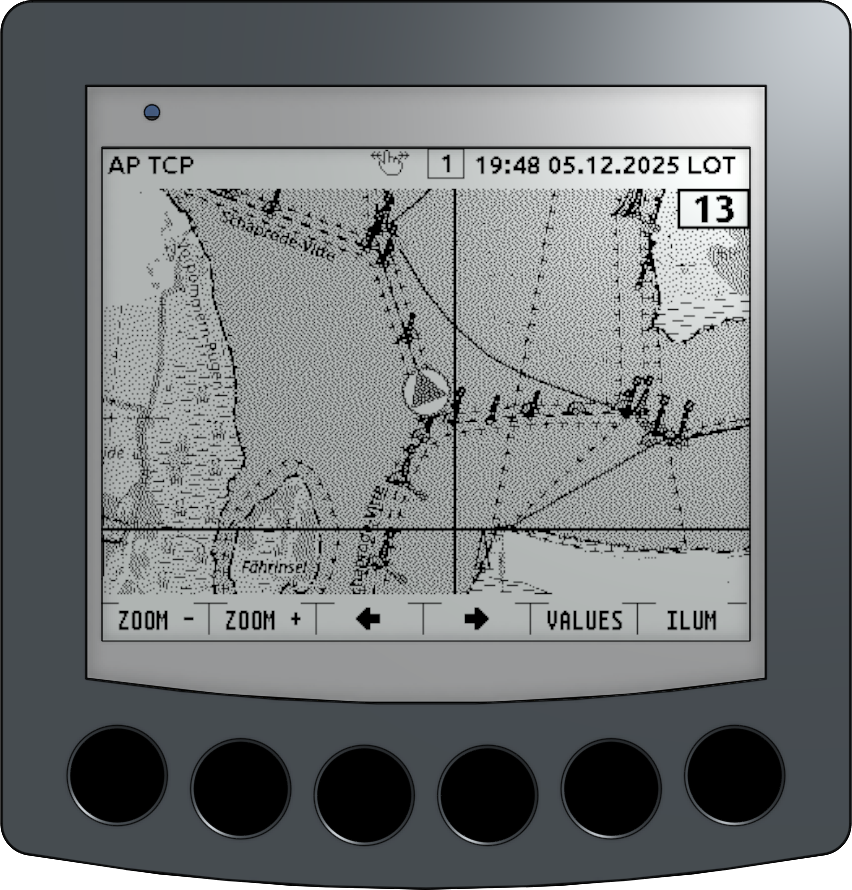
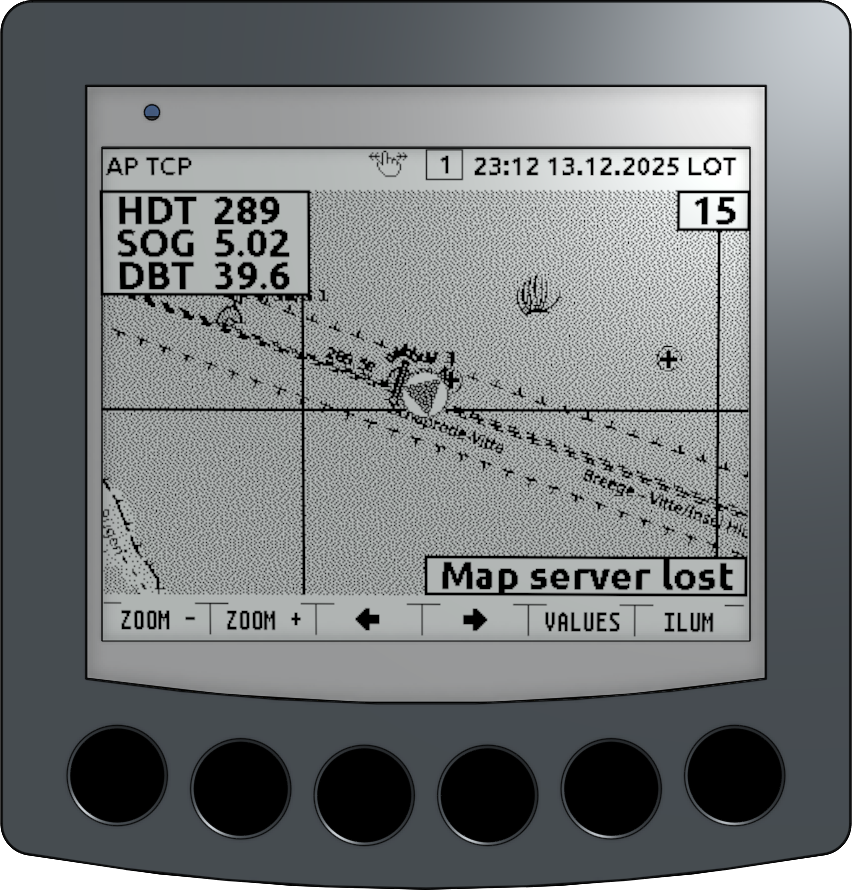
Fig.: Display Navigation
The navigation display shows the boat’s location on a nautical chart. The current zoom level is displayed in the upper right corner. Depending on the configuration, different charts can be used. Open Boat Projects provides a free, open-source chart service that is enabled by default. The chart data used is public nautical charts based on open data. The following functions are assigned to the buttons:
[Zoom -]- Zoom out of the map
[Zoom +]- Zoom in on the map
[<-]- Go to previous page
[->]- Switch to the next display page
[VALUES]- Display of HDT, SOG, DBT
[ILUM]- Light on/off
The current zoom level is displayed in the upper right corner of the screen. If the internet connection is interrupted, the message “Map server lost” will appear in the lower right corner. This indicates that the map server is no longer reachable online.
Note
To display nautical charts, the device must be connected to the internet via Wi-Fi, as the charts are not stored on the device itself. The advantage is that you always have access to the most up-to-date charts and don’t need to worry about updating the chart data. Ensure a sufficiently stable internet connection to avoid interruptions in the chart display.
Tip
You can also run your own Docker service on a Raspberry Pi in your boat to provide the nautical charts. This allows you to display the charts on the device independently of an internet connection. As an alternative to the Open Boat Projects nautical chart service, you can also use your own cloud server with an internet connection. Docker Hub offers Docker-Container that you can use for a self-hosted nautical chart service.
Battery
Fig.: Battery indicator
The battery display shows the current values for on-board voltage, current, and power. In addition to the measured values, the abbreviations and units are displayed. To display the battery values, an I2C module INA226 must be connected to the I2C bus and set to address 0x41. The shunt can be configured for various maximum currents in amperes [10|50|], 100|200|, 300|400|, 500] under Config - OBP Hardware.
Hint
Keep in mind that the inaccuracy of the measurements increases with higher currents. Select the shunt to suit typical usage scenarios and ensure it is not oversized. The shunt’s measurement inputs are intrinsically safe up to twice the maximum current and can withstand short-term overloads.
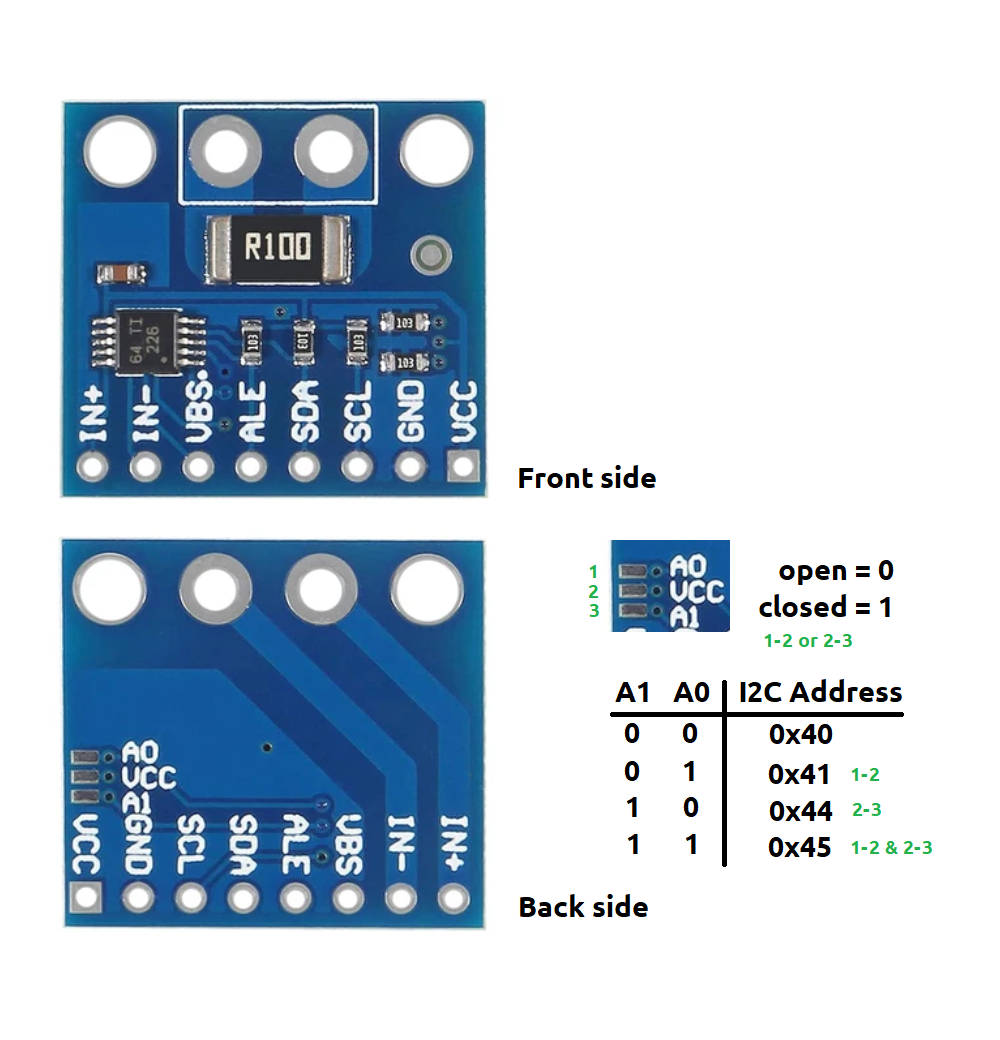
Fig.: I2C address assignment INA226
For measurement with an external power shunt, the large black resistor R100 on the front of the circuit board must be removed. The module should then be wired as follows.
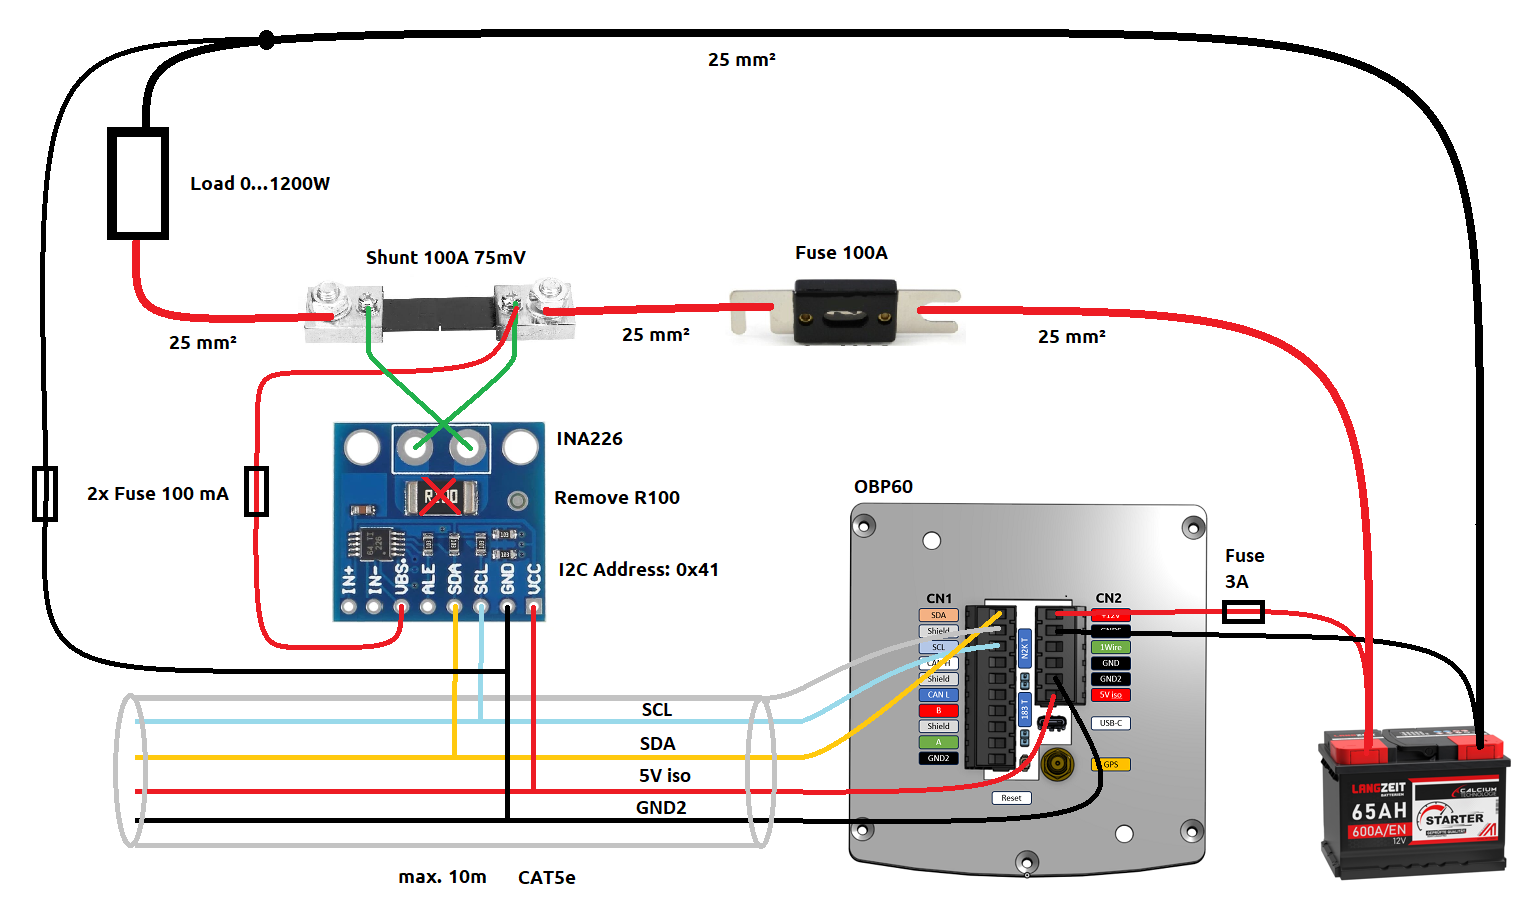
Fig.: Circuit diagram INA226 battery monitoring
Note
If you are using the battery indicator but no INA226 module is connected to the I2C bus, no readings will be displayed.
Warning
For the power circuit, use sufficiently large conductor cross-sections that are rated for the maximum current. Use appropriate fuses in the power circuits to prevent cable fires in the event of short circuits. For a long-lasting installation, use stranded wire with tinned individual conductors. If this is not possible for cost reasons, the cable ends should be fitted with crimped cable lugs or ferrules. The cable lugs should then be additionally soldered with tin to prevent corrosion in the cable sleeves. Covering the crimped and soldered joints with heat-shrink tubing prevents moisture from rising up the cable, which can also cause corrosion over long periods. Ensure that the INA226 is housed in a waterproof, insulated enclosure and that the sensor connections VBS and GND are protected with a 100 mA fuse. If you lack sufficient expertise, you should have the sensor installed by a qualified professional or have your installation checked by a qualified professional before commissioning.
Danger
Improper or faulty electrical installations can cause fires and endanger lives. Regularly check the installation for proper function and safety.
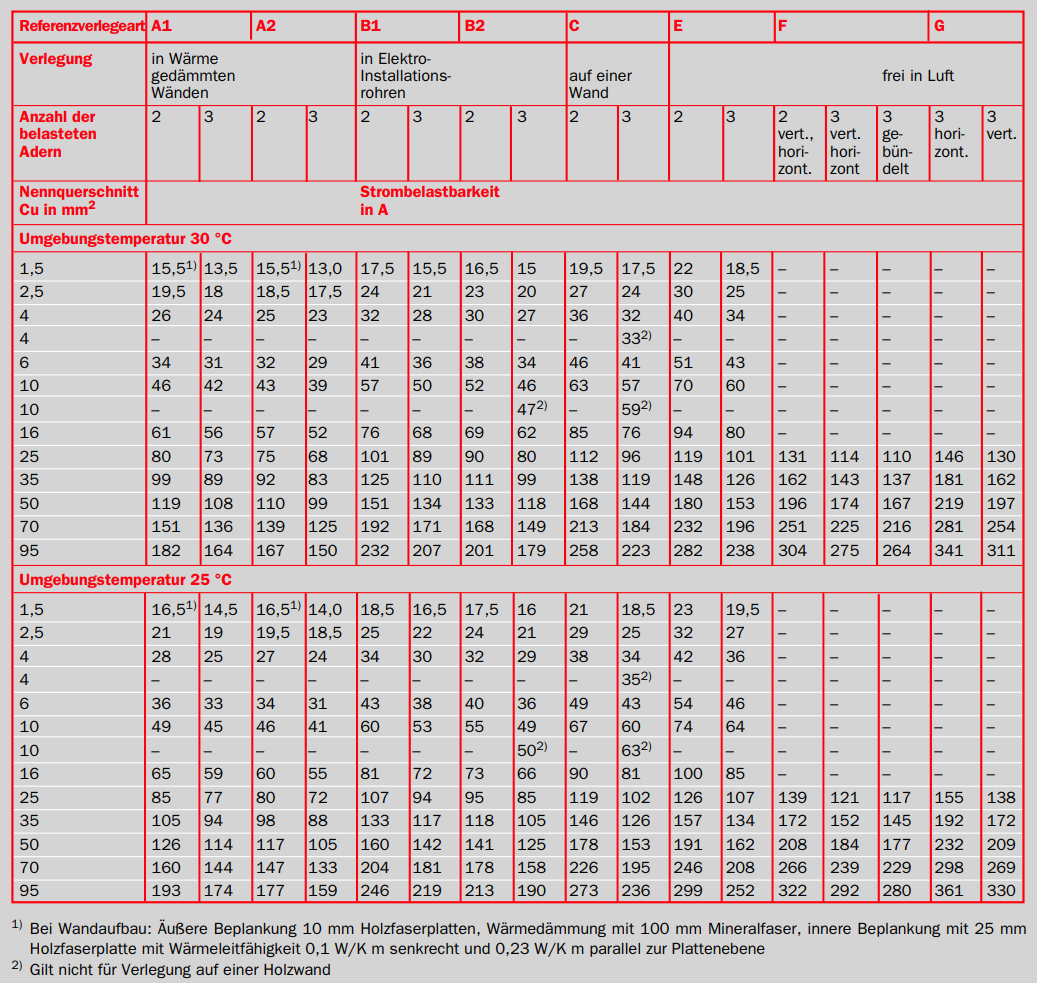
Fig.: Conductor cross-sections (EP 12/00)
For further information, you can use the information material Lines and Cables pdf.
Battery2
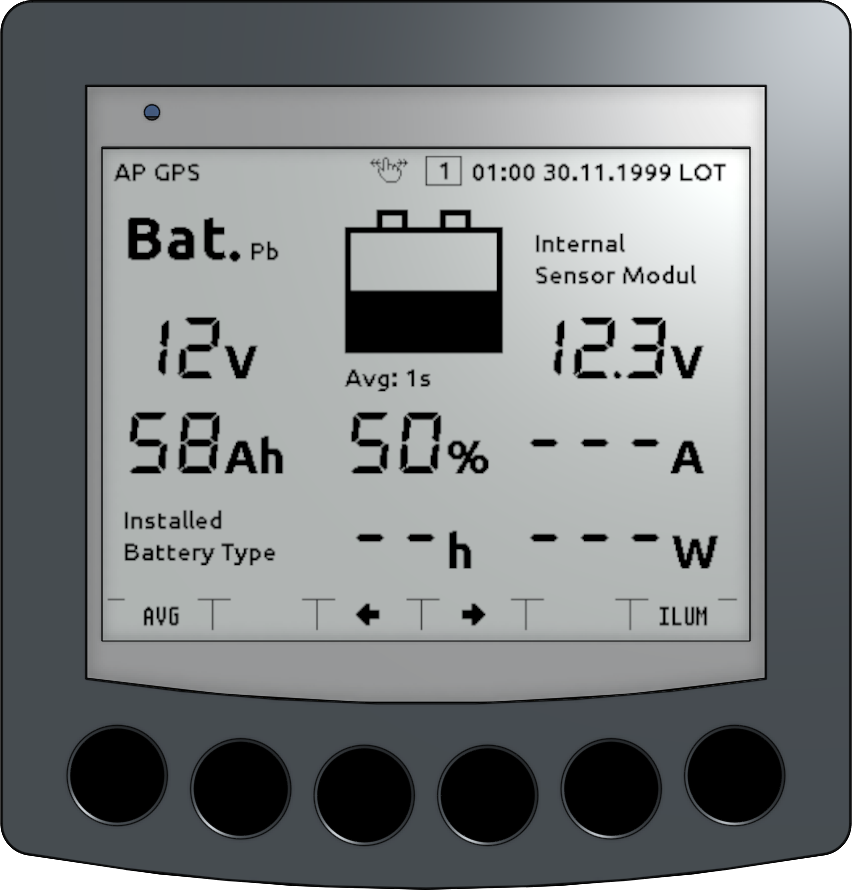
Fig.: Battery2 display
The following values are displayed in the Battery2 display:
Battery type [Pb|Gel|AGM|LiFePo4]
Nominal battery voltage in V
Nominal battery capacity in Ah
Graphical fill level display in %
Estimated range in hours based on current consumption figures
Sensor module type [internal sensor|INA219|INA226]
Current battery voltage in V
Current electricity consumption in A
Current power in W
The following functions can be used via the keys.
[AVG]- Setting the averaging depth in seconds [1|30|60|300]
Warning
The range indicator provides an approximate time estimate of how long the battery will supply power based on current consumption. This time depends on the current power consumption and adjusts continuously. The battery voltage is used to determine the range and thus the battery’s charge level. This method is not very precise and depends on the battery’s age. In non-critical situations, check the accuracy of the range indicator and plan for appropriate safety margins to avoid unexpected breakdowns.
Hint
Use a long averaging time of 300 seconds via the [AVG] button to obtain a realistic range display. This smooths out power consumption peaks and results in a significantly more stable range value.
To display the battery values, an I2C module INA226 must be connected to the I2C bus and set to address 0x41. The shunt can be configured for various maximum currents in amperes [10|50|]100|200|300|400|500] under Config - OBP Hardware.
Hint
Keep in mind that the inaccuracy of the measurements increases with higher currents. Select the shunt to suit typical usage scenarios and ensure it is not oversized. The shunt’s measurement inputs are intrinsically safe up to twice the maximum current and can withstand short-term overloads.
Fig.: I2C address assignment INA226
For measurement with an external power shunt, the large black resistor R100 on the front of the circuit board must be removed. The module should then be wired as follows.
Fig.: Circuit diagram INA226 battery monitoring
Note
If you are using the battery indicator but no INA226 module is connected to the I2C bus, no readings other than the current battery voltage will be displayed. In this case, the OBP60’s internal voltage sensor is used. The measured voltage value may not directly correspond to the voltage at the battery, as line losses can distort the voltage reading.
Warning
The hazards and risks associated with using the INA226 for battery monitoring are the same as described in the Battery chapter. Follow the recommendations and be aware of the hazards.
RollPitch
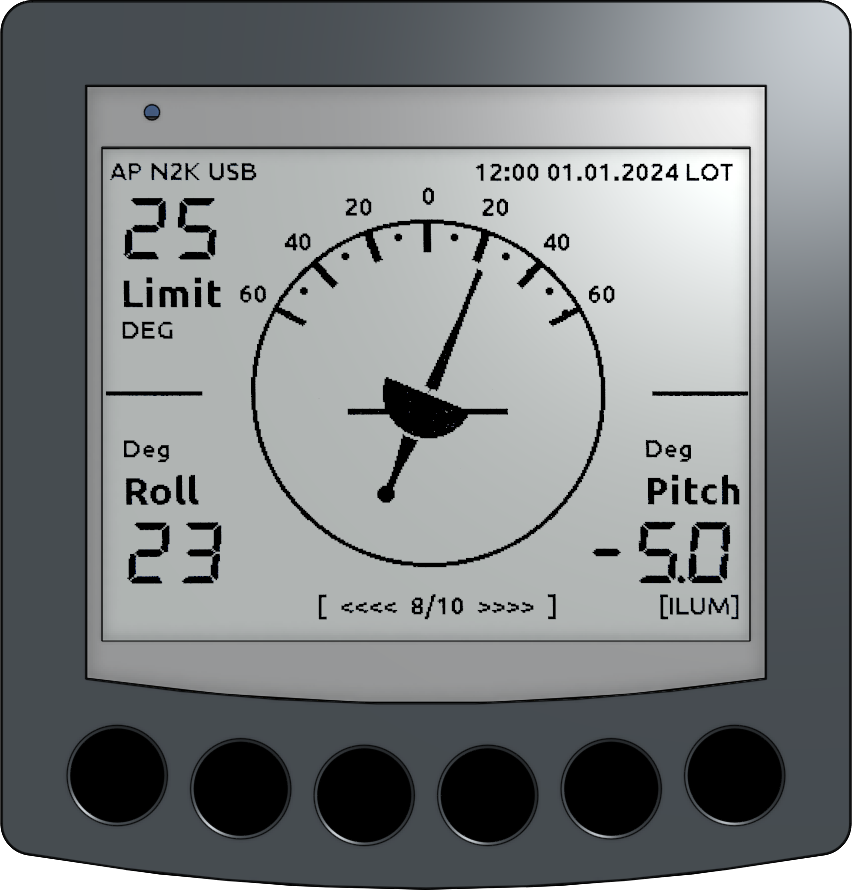
Fig.: RollPitch display
The RollPitch display shows the current roll and pitch values, as well as the threshold at which a visual signal is emitted via the flash LED. Pitch corresponds to the longitudinal tilt and roll to the lateral tilt of the boat. The sensor values must be entered as XDR telegrams in the form of xdrRoll and xdrPitch (see configuration page: XDR). The following mappings must be observed:
Roll - Lateral tilt
Pitch - Longitudinal tilt
Solar
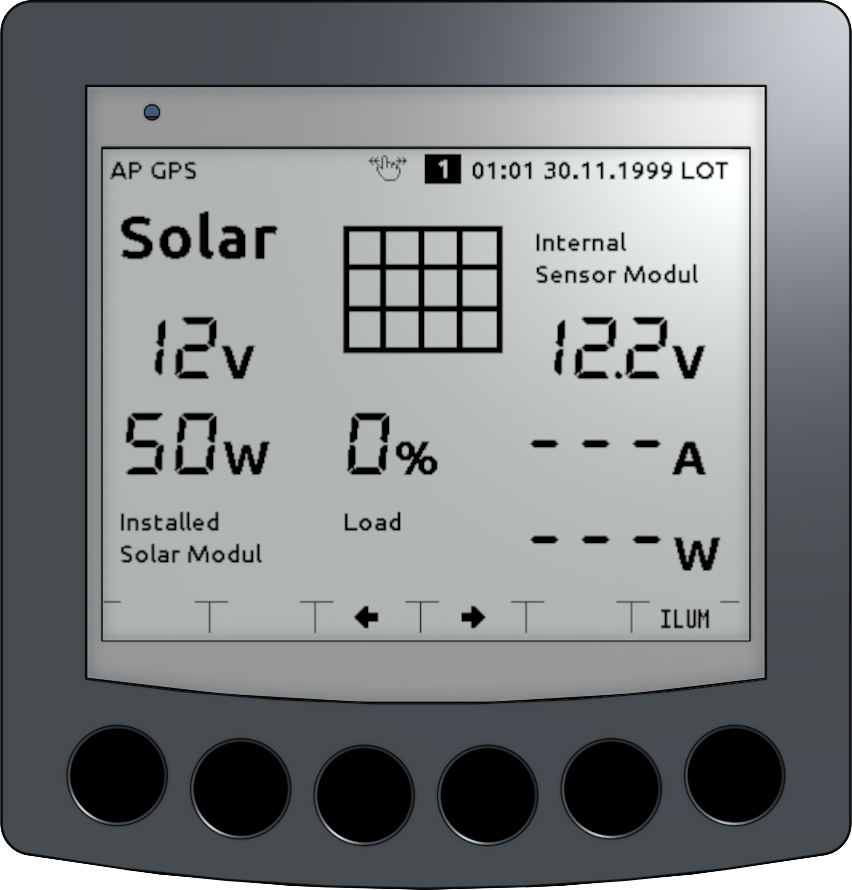
Fig.: Solar display
The solar display shows the following values:
Nominal voltage of the solar modules in V
Nominal power of the solar modules in W
Utilization rate in %
Sensor module type [internal sensor|INA219|INA226]
Current solar voltage in V
Current solar feed-in in A
Current feed-in power in W
The following functions can be used via the keys.
[AVG]- Setting the averaging depth in seconds [1|30|60|300]
To display the measured values, an I2C module INA226 must be connected to the I2C bus and set to address 0x44. The shunt can be configured for various maximum currents in amperes [10|50|]100|200|300|400|500] under Config - OBP Hardware.
Hint
Keep in mind that the inaccuracy of the measurements increases with higher currents. Select the shunt to suit typical usage scenarios and ensure it is not oversized. The shunt’s measurement inputs are intrinsically safe up to twice the maximum current and can withstand short-term overloads.
Fig.: I2C address assignment INA226
For measurement with an external power shunt, the large black resistor R100 on the front of the circuit board must be removed. The module should then be wired as follows.
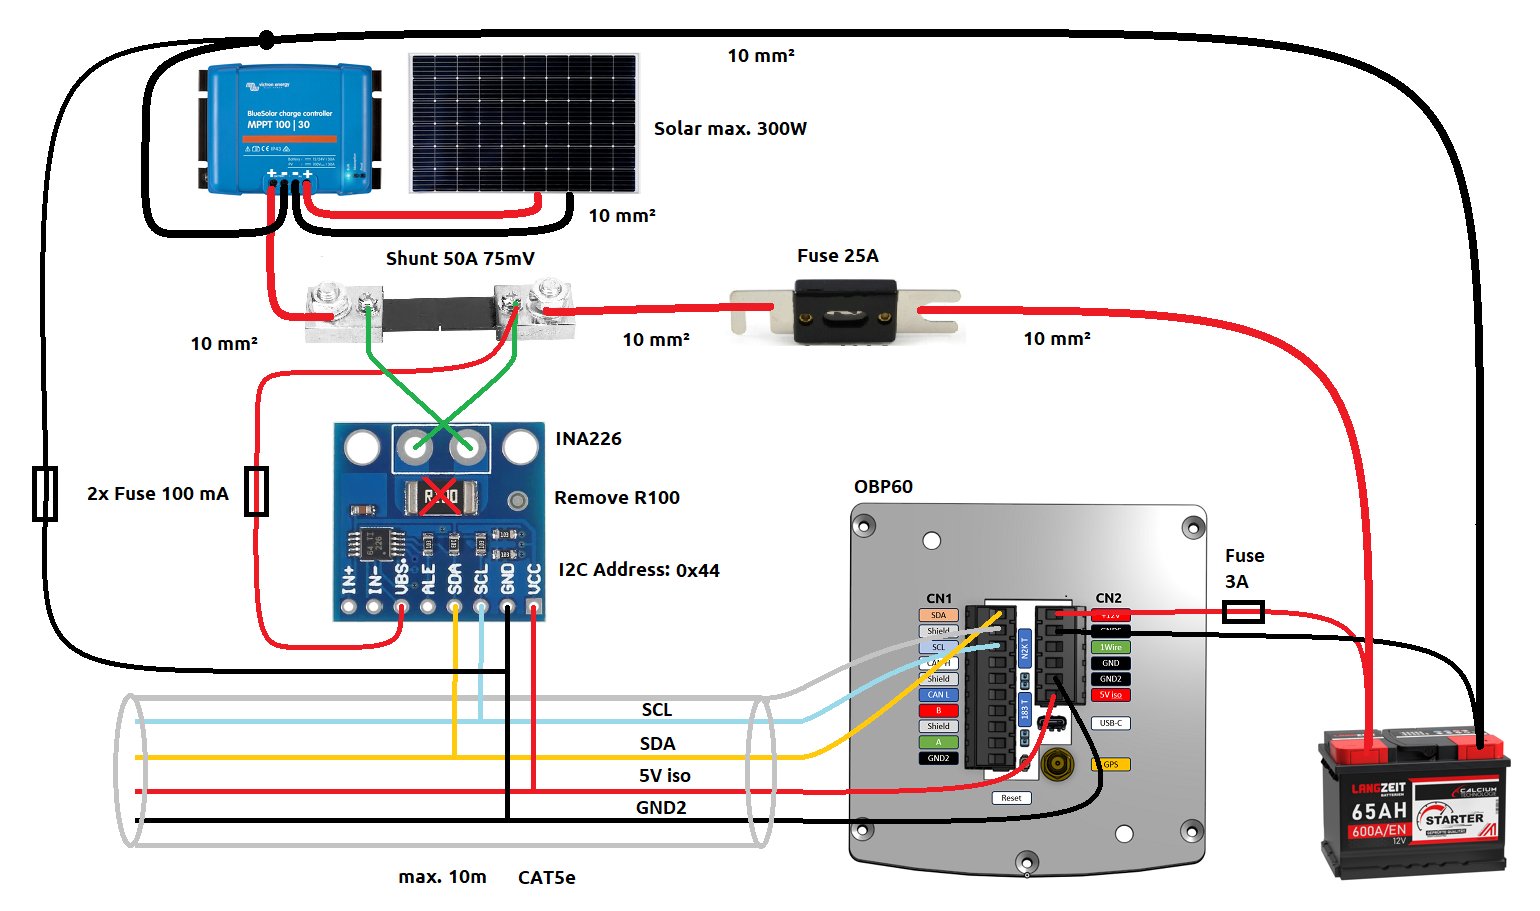
Fig.: Circuit diagram INA226 solar monitoring
Note
If you are using the solar display but no INA226 module is connected to the I2C bus, no readings other than the current battery voltage will be displayed. In this case, the OBP60’s internal voltage sensor is used. The measured voltage value may not directly correspond to the voltage at the inverter’s output, as line losses can distort the voltage reading.
Warning
The hazards and risks associated with using the INA226 for battery monitoring are the same as described in the Battery chapter. Follow the recommendations and be aware of the hazards.
Generator
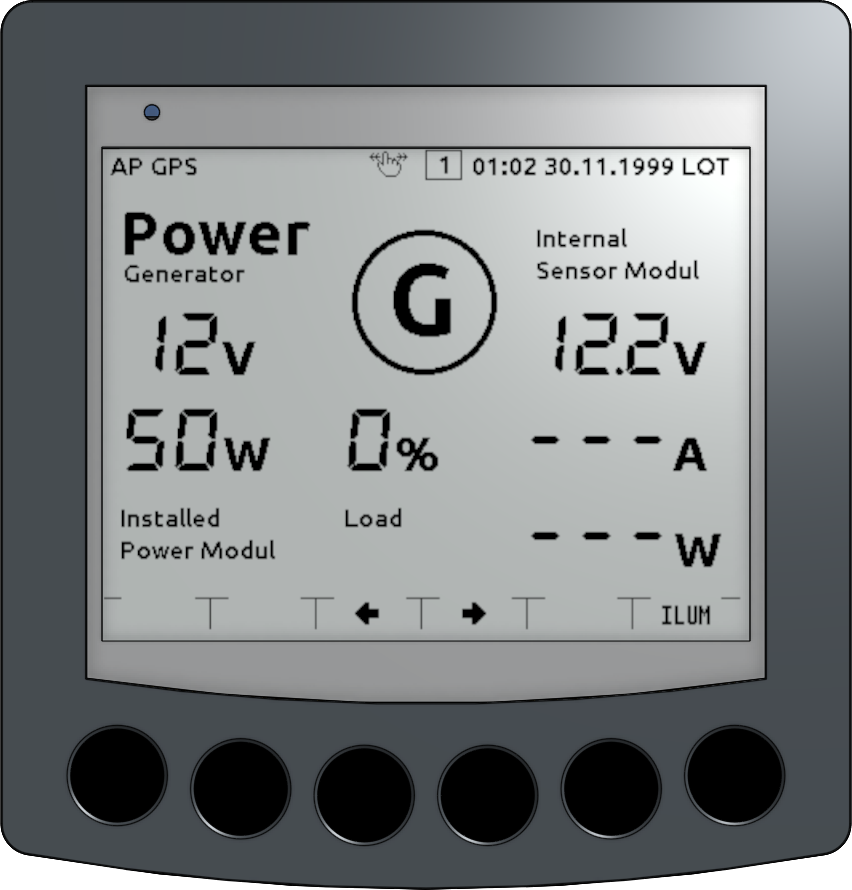
Fig.: Display Generator
The generator display shows the following values:
Rated voltage of the generator in V
Rated power of the generator in W
Utilization rate in %
Sensor module type [internal sensor|INA219|INA226]
Current generator voltage in V
Current generator feed-in in A
Current generator output in W
The following functions can be used via the keys.
[AVG]- Setting the averaging depth in seconds [1|30|60|300]
To display the measured values, an I2C module INA226 must be connected to the I2C bus and set to address 0x45. The shunt can be configured for various maximum currents in amperes [10|50|]100|200|300|400|500] under Config - OBP Hardware.
Hint
Keep in mind that the inaccuracy of the measurements increases with higher currents. Select the shunt to suit typical usage scenarios and ensure it is not oversized. The shunt’s measurement inputs are intrinsically safe up to twice the maximum current and can withstand short-term overloads.
Fig.: I2C address assignment INA226
For measurement with an external power shunt, the large black resistor R100 on the front of the circuit board must be removed. The module should then be wired as follows.
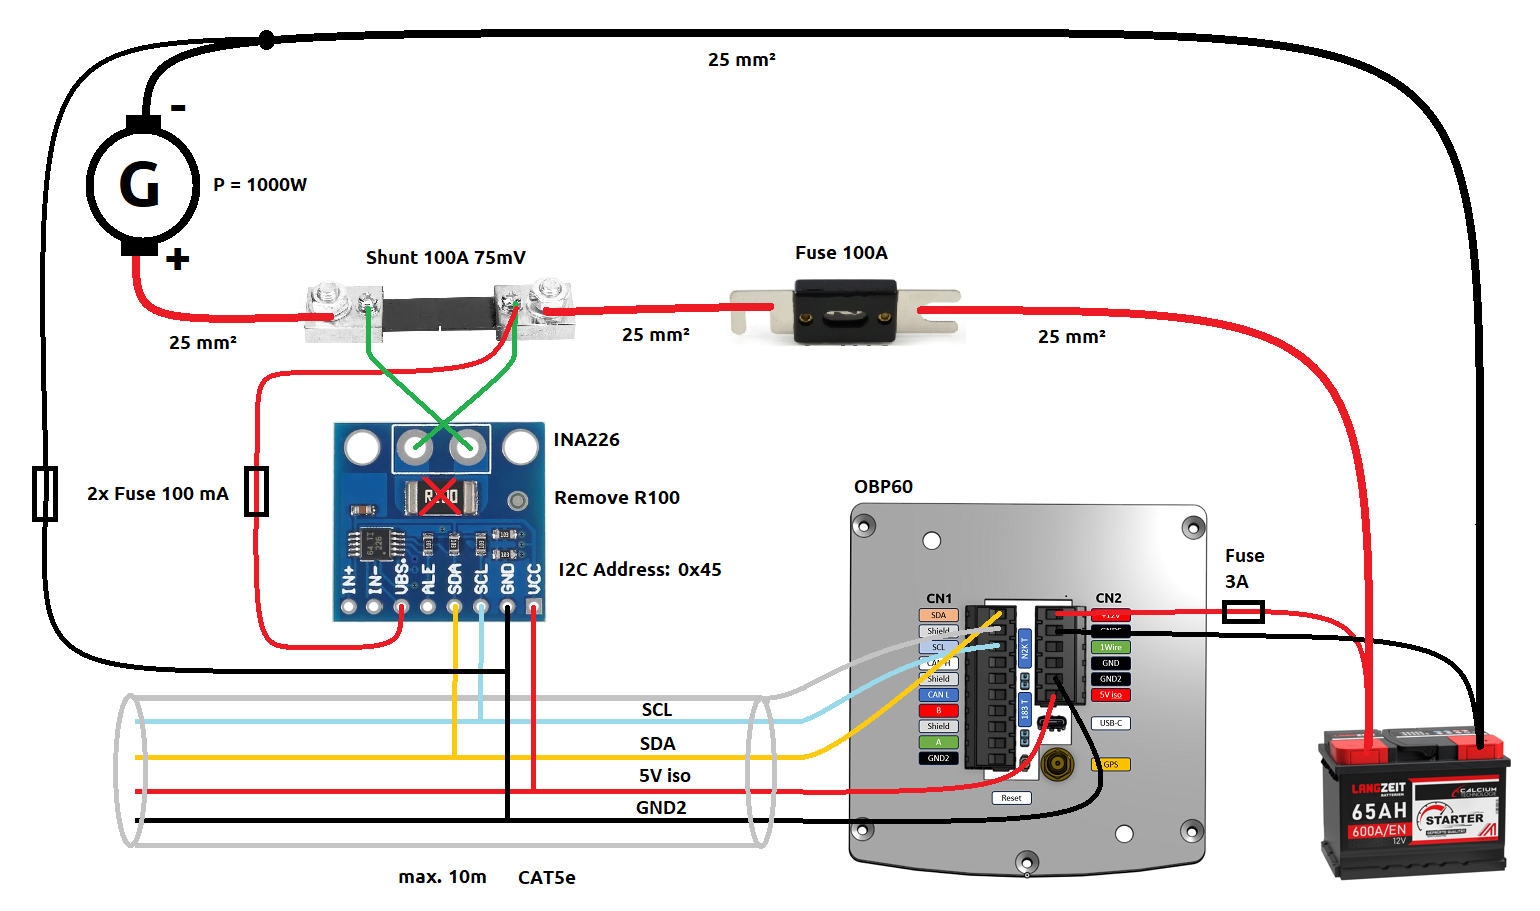
Fig.: Circuit diagram INA226 generator monitoring
Note
If you are using the generator display but no INA226 module is connected to the I2C bus, no readings other than the current battery voltage will be displayed. In this case, the OBP60’s internal voltage sensor is used. The measured voltage value may not directly correspond to the voltage at the generator output, as line losses can distort the voltage reading.
Warning
The hazards and risks associated with using the INA226 for battery monitoring are the same as described in the Battery chapter. Follow the recommendations and be aware of the hazards.
Digital Out
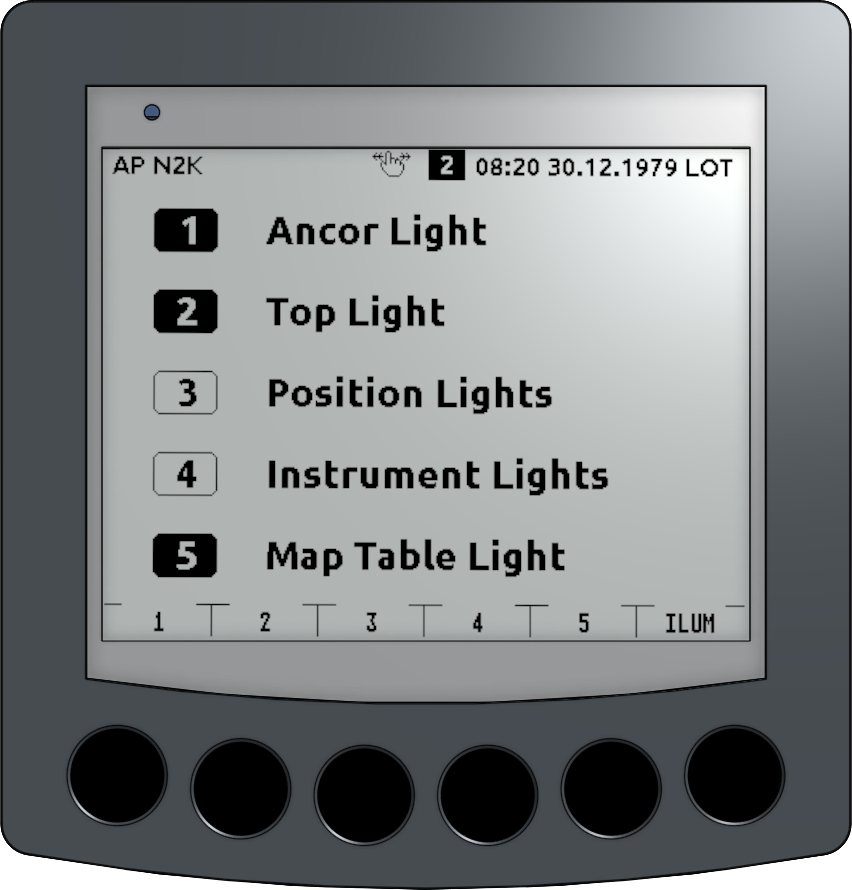
Fig.: Digital Out Display
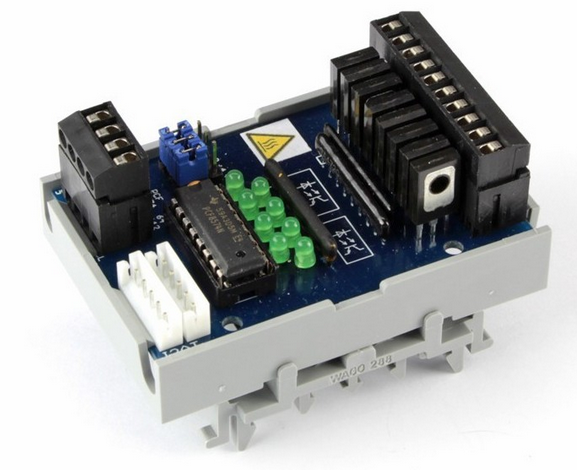
Fig.: I2C output module with optocoupler
The digital output display is used to operate an output module and to display switching states. The I2C-Ausgabemodul from Horter & Kalb can be used as the output module. This allows digital switching states to be output. The buttons have the following meanings:
[1]- Output 1 on/off
[2]- Output 2 on/off
[3]- Output 3 on/off
[4]- Output 4 on/off
[5]- Output 5 on/off
[ILUM]- Light on/off
Outputs 6, 7, and 8 cannot be accessed via this page and remain unused. The module is available as an open-source DIY kit and has the following technical specifications:
Galvanic isolation between I2C bus and power circuit
Negative logic of the output signal
Supports 12/24V power circuits
40V max. voltage of the power circuit
1A max. output current
Version as a DIN rail module
4 Selectable I2C addresses
The digital output module allows you to directly power loads up to 12W in 12V circuits, such as incandescent lamps, LED lamps, solenoid valves, or relays. Use shielded cables for the I2C connection, connecting the shield to the OBP60 and leaving the shield on the digital output module unconnected. For the module’s 5V power supply, you can use terminals 5Viso and GND2 on connector CN2 of the OBP60. The display text behind the buttons can be customized via the configuration. Up to four modules of the same type can be operated and controlled on the I2C bus.
Tip
If you want to switch larger loads, you can use a relay at the digital output. Depending on the type of relay used, this allows you to switch loads of up to 3000W. A relay can also be used to switch loads in 230V AC circuits.
Warning
The digital output module lacks reverse polarity protection and power limiting. Reverse polarity or excessive loads can destroy the digital output module. When switching inductive loads, a freewheeling diode must be used across the coil to suppress dangerous back EMF. Continuous switching of high loads can cause the power transistors to overheat. Ensure adequate ventilation or reduce the load if ventilation is insufficient.
XDR
The XDR configuration page allows you to create XDR Sentences for NMEA0183. XDR Sentences are telegrams for generic sensor values used when no suitable NMEA0183 telegram can be found to transmit the desired sensor values. It is a universal telegram for transmitting sensor data. If unassigned sensor data is present in the OBP60, it can be assigned via an XDR mapping. This makes the data generally usable as NMEA0183 telegrams and displays it in the OBP60. The data can then also be transmitted to other systems via NMEA0183 and used there. XDR Sentences are always used when data from the I2C bus, the 1-Wire bus, or internal sensor data from the ESP32 needs to be transmitted.
An XDR sentence is structured as follows:
Sensor Values
$–XDR,a,x.x,b,c–c,x–x*hh<CR><LF>
- Field number:
A - Sensor-Typ
X.x - measured value
B - Unit of measurement
C - Name des Sensors
X - Further sensor data
Hh - Checksumme
- Examples:
$IIXDR,C,19.52,C,TempAir*19
$IIXDR,P,1.02481,B,Barometer*29
Measurement |
Sensor Type |
Examples of measurement data |
Unit |
Name des Sensors |
|---|---|---|---|---|
Air pressure |
P Print |
0.8..1.1 Or 800..1100 |
B Bar |
Barometer |
Air temperature |
C Temperature |
2 Decimal places |
C Celsius |
TempAir or ENV_OUTAIR_T |
Pitch |
A Shop |
-180..0 Downwards 0..180 upwards |
D Degrees |
PTCH or PITCH |
Rolling |
A Shop |
-180..0 Left 0..180 right |
D Degrees |
ROLL |
Water temperature |
C Temperature |
2 Decimal places |
C Celsius |
ENV_WATER_T |
Up to 30 XDR telegrams can be individually created via the XDR configuration page.
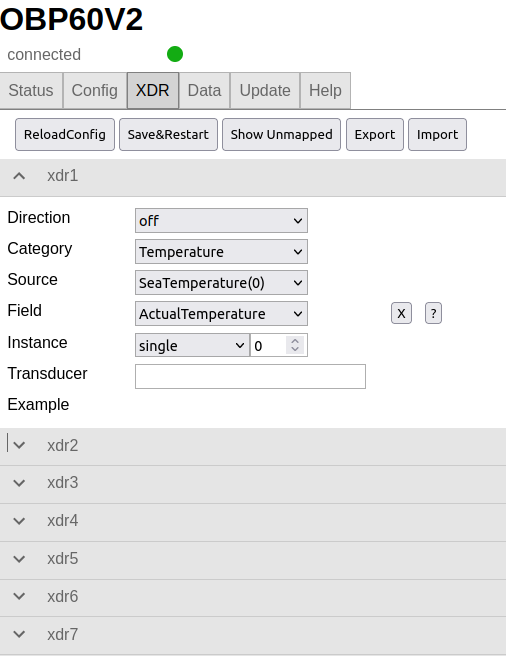
First, you open a list of unlinked sensor data via Show Unmapped.
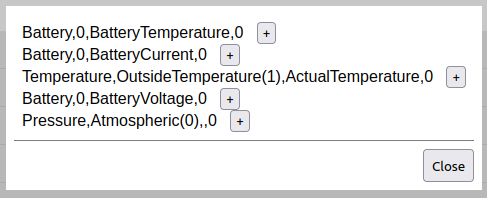
The list will then show you which data is available. Using +, the data is automatically inserted into the last available XDR configuration and assigned to the correct category. The sensor name still needs to be added in the Transducer field.
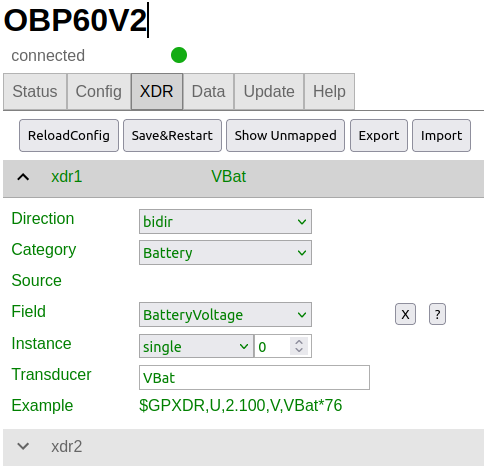
After assigning the sensor name, an example XDR telegram is displayed under Example. All settings can then be customized. An explanation of the settings is provided below.
- Direction
The Direction setting allows you to configure how sensor data should be read and where it should be transmitted:
Off- The sensor data is not used. This allows you to deactivate an already configured XDR telegram.Bidir- Sensor data is exchanged between NMEA0183 and NMEA2000.To2K- The sensor data is only sent via NMEA2000.From2k- Sensor data is read from NMEA2000.
- Category
A sensor type can be assigned via Category:
Temperature- Temperature sensors e.g. for air, water, cooling devicesHumidity- Humidity sensorsPressure- Pressure sensors for air pressure and other pressures such as oil pressureFluid- Sensors for liquids such as flow rate and fill levelBattery- Battery sensors for voltage, current, power, battery temperatureEngine- Engine sensors for speed, angle, trim tabs, oil, coolantAttitude- Position data, determined from position sensor data
- Source
The Source setting allows you to configure the source of the sensor data more precisely. Different sensor sources are available depending on the type of sensor used.
- Field
The Field setting allows for a more precise description of how the sensor data should be interpreted. It comprises additional data that can be configured contextually, depending on the sensor type used. For example, it can be specified whether a value is a display value or a setting value.
- Instance
The Instance property allows you to specify whether there are multiple sensors of the same type. This can occur, for example, if two engines are installed in a boat and two fuel level readings need to be displayed. The sensors are distinguished using an instance number. For example, #1 is appended to the sensor name. The instantiation can be configured as follows:
Single- A sensor is instantiated and assigned a free instance number. This allows, for example, two sensors to transmit the same data in an XDR telegram if the sensors are redundant.Ignore- There is only one sensor of this type.Auto- Instantiation is handled automatically. As soon as a new sensor of the same type and source is used, a new instance of the sensor is created.
- Transducer
The sensor name is set via Transducer. This is a plain text description of the sensor using ASCII characters. Use only letters and numbers without spaces or special characters.
Note
Use no more than 6 characters and use common abbreviations. Longer names will be truncated to 6 characters due to limited display space.
- Example
Example of what the content of the XDR telegram will look like.
- Read in NMEA0183 XDR
Incoming NMEA0183 data also requires an XDR mapping before it is available on the OBP60. For example, if NMEA0183 XDR data arrives in the following format:
$IIXDR,A,0.9,D,PTCH,A,0.8,D,ROLL*5D, it can be used on the OBP60 with these settings: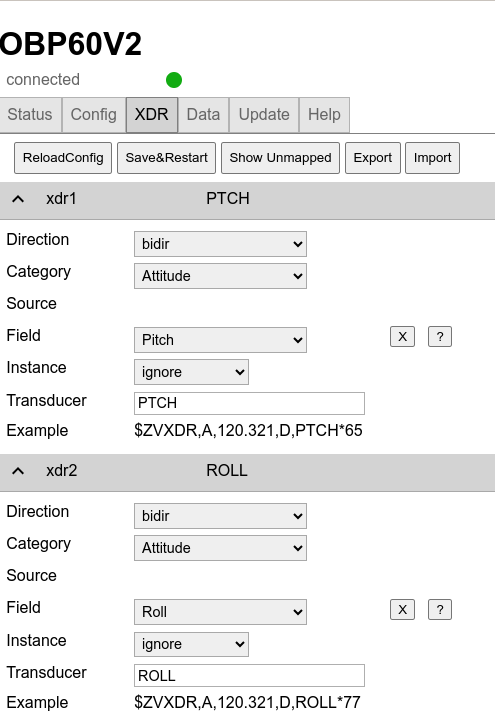
The data will then be available on the Data page and can also be selected in the display page configuration. However, you may need to reload the page in your web browser before the new entries become visible.
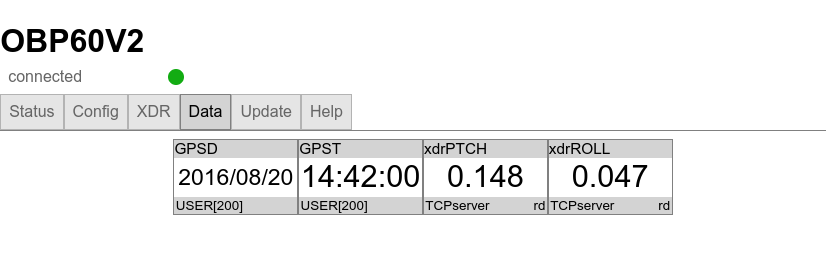
Data
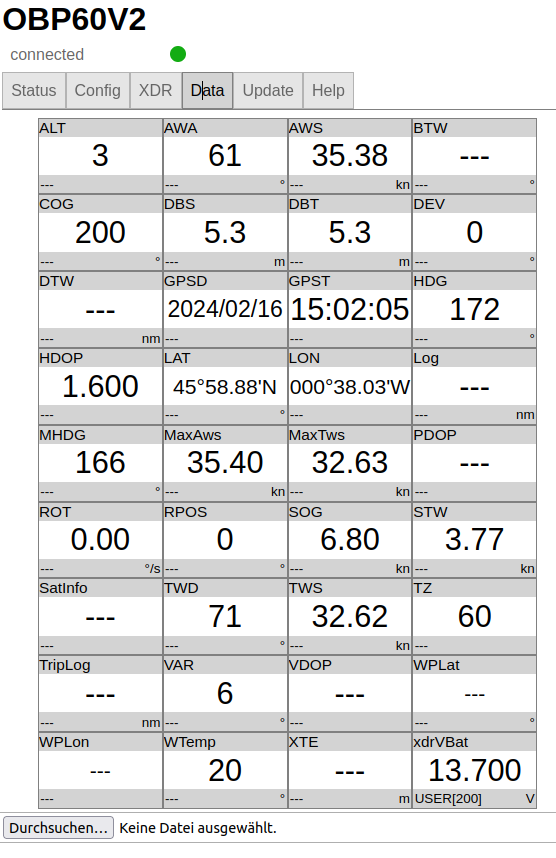
The “Data” section displays sensor data from all currently processed bus systems. Unavailable sensor data is marked with ---. The data display can also be configured to show only available data, hiding unavailable data fields.
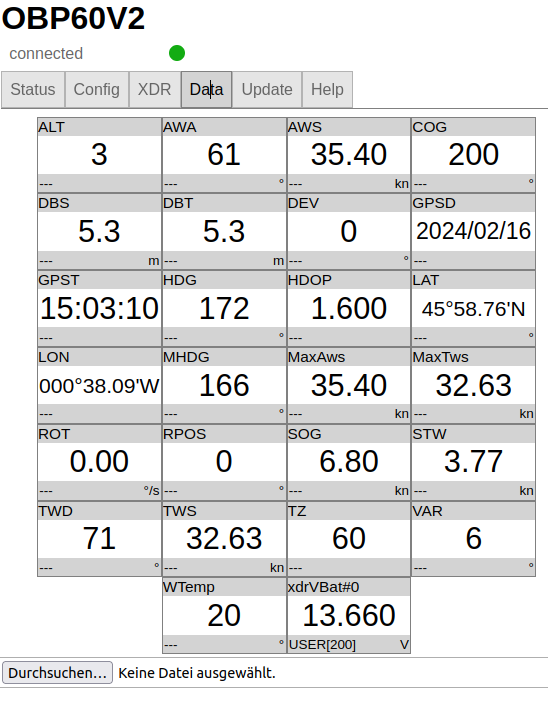
Note
Restricting the data display to current data means that the data order will change if some sensor data is no longer available. These data fields will then be hidden. If you prefer a fixed display format, it is best to display all data.
Update
To update a device’s firmware, you can use the Update tab. There are two types of firmware updates.
- Initial Firmware-Update
During the initial firmware update, the entire flash memory of the OBP60 is erased. All firmware components are then stored in the flash memory. This creates an initial configuration, overwriting any previous configuration. The initial firmware update uses the filename xxx-all.bin.
- Normales Firmware-Update
A normal firmware update only updates the program portion of the firmware. Existing configurations are retained and can be used again after the update. Normal firmware updates use the filename xxx-update.bin.
You can download the latest firmware from the following website:
Https://github.com/norbert-walter/esp32-nmea2000-obp60/releases
Under Releases you will find a number of available firmware updates for the OBP60. Please note the specific hardware version for which you want to use a firmware update.
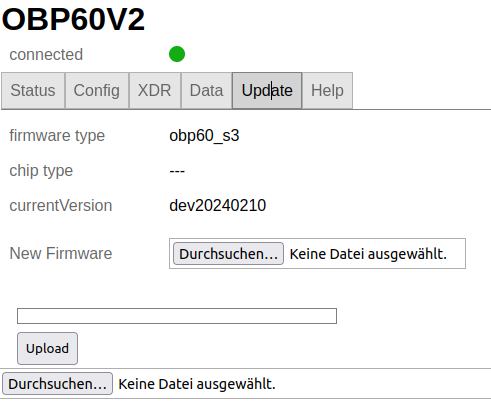
For a standard firmware update, download the desired firmware file and save it to your device. Then, select the downloaded file using the Choose File button. The firmware type, chip type, and firmware version will then be displayed. If the firmware is incompatible with your hardware, you will receive a message. In this case, the firmware cannot be flashed. Press the Upload button to start the flashing process. The progress bar will show the progress of the process. After a successful firmware update, the system will restart. During this time, the web configuration page will be offline (red dot). After the restart is complete, the page will be back online (green dot). The system will then be ready for use again.
Warning
Please note that when updating to an older firmware version, you should perform an Initial Firmware Update. This will prevent complications with the saved configuration data. Failure to do so may render the system unusable and cause it to freeze completely. A firmware update via the configuration pages will then no longer be possible. The firmware must then be flashed via USB.
How to perform an Initial Firmware Update, or flash the firmware of an OBP60 via USB, is described under Update.
Help
Under Help, you will be redirected to the GitHub page where the project is hosted. There you can find more detailed information about the NMEA2000 gateway, which forms the basis for this firmware.
Note
The GitHub page can only be accessed if the OBP60 has internet access. This can be achieved, for example, if the OBP60 is operating as a client on your boat’s Wi-Fi network, and your boat’s Wi-Fi network has internet access. Alternatively, you can, for example, create a hotspot on your mobile phone and connect the OBP60 to your phone as a Wi-Fi client.